Sprint - Nextel 2013 Annual Report Download - page 123
Download and view the complete annual report
Please find page 123 of the 2013 Sprint - Nextel annual report below. You can navigate through the pages in the report by either clicking on the pages listed below, or by using the keyword search tool below to find specific information within the annual report.-
 1
1 -
2
-
3
-
4
-
5
-
6
-
7
-
8
-
9
-
10
-
11
-
12
-
13
-
14
-
15
-
16
-
17
-
18
-
19
-
20
-
21
-
22
-
23
-
24
-
25
-
26
-
27
-
28
-
29
-
30
-
31
-
32
-
33
-
34
-
35
-
36
-
37
-
38
-
39
-
40
-
41
-
42
-
43
-
44
-
45
-
46
-
47
-
48
-
49
-
50
-
51
-
52
-
53
-
54
-
55
-
56
-
57
-
58
-
59
-
60
-
61
-
62
-
63
-
64
-
65
-
66
-
67
-
68
-
69
-
70
-
71
-
72
-
73
-
74
-
75
-
76
-
77
-
78
-
79
-
80
-
81
-
82
-
83
-
84
-
85
-
86
-
87
-
88
-
89
-
90
-
91
-
92
-
93
-
94
-
95
-
96
-
97
-
98
-
99
-
100
-
101
-
102
-
103
-
104
-
105
-
106
-
107
-
108
-
109
-
110
-
111
-
112
-
 113
113 -
 114
114 -
 115
115 -
 116
116 -
 117
117 -
 118
118 -
 119
119 -
 120
120 -
 121
121 -
 122
122 -
 123
123 -
 124
124 -
 125
125 -
 126
126 -
 127
127 -
 128
128 -
 129
129 -
 130
130 -
 131
131 -
 132
132 -
 133
133 -
134
-
135
-
136
-
137
-
138
-
139
-
140
-
141
-
142
-
143
-
144
-
145
-
146
-
147
-
148
-
149
-
150
-
151
-
152
-
153
-
154
-
155
-
156
-
157
-
158
-
159
-
160
-
161
-
162
-
163
-
164
-
165
-
166
-
167
-
168
-
169
-
170
-
171
-
172
-
173
-
174
-
175
-
176
-
177
-
178
-
179
-
180
-
181
-
182
-
183
-
184
-
185
-
186
-
187
-
188
-
189
-
190
-
191
-
192
-
193
-
194
-
195
-
196
-
197
-
198
-
199
-
200
-
201
-
202
-
203
-
204
-
205
-
206
-
207
-
208
-
209
-
210
-
211
-
212
-
213
-
214
-
215
-
216
-
217
-
218
-
219
-
220
-
221
-
222
-
223
-
224
-
225
-
226
-
227
-
228
-
229
-
230
-
231
-
232
-
233
-
234
-
235
-
236
-
237
-
238
-
239
-
240
-
241
-
242
-
243
-
244
-
245
-
246
-
247
-
248
-
249
-
250
-
251
-
252
-
253
-
254
-
255
-
256
-
257
-
258
-
259
-
260
-
261
-
262
-
263
-
264
-
265
-
266
-
267
-
268
-
269
-
270
-
271
-
272
-
273
-
274
-
275
-
276
-
277
-
278
-
279
-
280
-
281
-
282
-
283
-
284
-
285
 |
 |

Table of Contents
Index to Consolidated Financial Statements
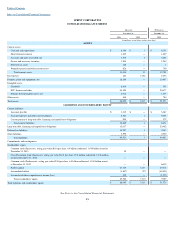
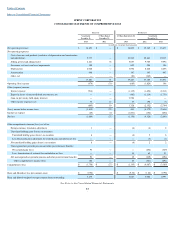
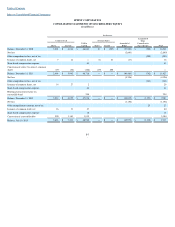
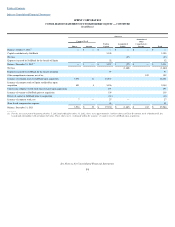
SPRINT CORPORATION
CONSOLIDATED STATEMENTS OF COMPREHENSIVE LOSS
See Notes to the Consolidated Financial Statements
F
-
5
Successor
Predecessor
Year Ended
December 31,
87 Days Ended
December 31,
191 Days Ended July 10,
Year Ended
December 31,
2013
2012
2013
2012
2011
(in millions, except per share amounts)
Net operating revenues
$
16,891
$
—
$
18,602
$
35,345
$
33,679
Net operating expenses:
Cost of services and products (exclusive of depreciation and amortization
included below)
9,777
—
10,545
20,841
19,015
Selling, general and administrative
4,841
33
5,067
9,765
9,592
Severance, exit costs and asset impairments
309
—
652
298
106
Depreciation
2,026
—
3,098
6,240
4,455
Amortization
908
—
147
303
403
Other, net
—
—
(22
)
(282
)
—
17,861
33
19,487
37,165
33,571
Operating (loss) income
(970
)
(33
)
(885
)
(1,820
)
108
Other (expense) income:
Interest expense
(918
)
—
(1,135
)
(1,428
)
(1,011
)
Equity in losses of unconsolidated investments, net
—
—
(482
)
(1,114
)
(1,730
)
Gain on previously-held equity interests
—
—
2,926
—
—
Other income (expense), net
73
10
19
190
(3
)
(845
)
10
1,328
(2,352
)
(2,744
)
(Loss) income before income taxes
(1,815
)
(23
)
443
(4,172
)
(2,636
)
Income tax expense
(45
)
(4
)
(1,601
)
(154
)
(254
)
Net loss
(1,860
)
(27
)
(1,158
)
(4,326
)
(2,890
)
Other comprehensive income (loss), net of tax:
Foreign currency translation adjustment
3
—
(8
)
(4
)
2
Unrealized holding gains (losses) on securities:
Unrealized holding gains (losses) on securities
6
—
(4
)
5
6
Less: Reclassification adjustment for realized gains included in net loss
—
—
—
(3
)
(4
)
Net unrealized holding gains (losses) on securities
6
—
(4
)
2
2
Unrecognized net periodic pension and other postretirement benefits:
Net actuarial gain (loss)
93
—
—
(404
)
(349
)
Less: Amortization of actuarial loss included in net loss
—
—
35
65
55
Net unrecognized net periodic pension and other postretirement benefits
93
—
35
(339
)
(294
)
Other comprehensive income (loss)
102
—
23
(341
)
(290
)
Comprehensive loss
$
(1,758
)
$
(27
)
$
(1,135
)
$
(4,667
)
$
(3,180
)
Basic and diluted net loss per common share
$
(0.54
)
$
(0.38
)
$
(1.44
)
$
(0.96
)
Basic and diluted weighted average common shares outstanding
3,475
3,027
3,002
2,995