Sprint - Nextel 2013 Annual Report Download - page 48
Download and view the complete annual report
Please find page 48 of the 2013 Sprint - Nextel annual report below. You can navigate through the pages in the report by either clicking on the pages listed below, or by using the keyword search tool below to find specific information within the annual report.-
 1
1 -
2
-
3
-
4
-
5
-
6
-
7
-
8
-
9
-
10
-
11
-
12
-
13
-
14
-
15
-
16
-
17
-
18
-
19
-
20
-
21
-
22
-
23
-
24
-
25
-
26
-
27
-
28
-
29
-
30
-
31
-
32
-
33
-
34
-
35
-
36
-
37
-
 38
38 -
 39
39 -
 40
40 -
 41
41 -
 42
42 -
 43
43 -
 44
44 -
 45
45 -
 46
46 -
 47
47 -
 48
48 -
 49
49 -
 50
50 -
 51
51 -
 52
52 -
 53
53 -
 54
54 -
 55
55 -
 56
56 -
 57
57 -
 58
58 -
59
-
60
-
61
-
62
-
63
-
64
-
65
-
66
-
67
-
68
-
69
-
70
-
71
-
72
-
73
-
74
-
75
-
76
-
77
-
78
-
79
-
80
-
81
-
82
-
83
-
84
-
85
-
86
-
87
-
88
-
89
-
90
-
91
-
92
-
93
-
94
-
95
-
96
-
97
-
98
-
99
-
100
-
101
-
102
-
103
-
104
-
105
-
106
-
107
-
108
-
109
-
110
-
111
-
112
-
113
-
114
-
115
-
116
-
117
-
118
-
119
-
120
-
121
-
122
-
123
-
124
-
125
-
126
-
127
-
128
-
129
-
130
-
131
-
132
-
133
-
134
-
135
-
136
-
137
-
138
-
139
-
140
-
141
-
142
-
143
-
144
-
145
-
146
-
147
-
148
-
149
-
150
-
151
-
152
-
153
-
154
-
155
-
156
-
157
-
158
-
159
-
160
-
161
-
162
-
163
-
164
-
165
-
166
-
167
-
168
-
169
-
170
-
171
-
172
-
173
-
174
-
175
-
176
-
177
-
178
-
179
-
180
-
181
-
182
-
183
-
184
-
185
-
186
-
187
-
188
-
189
-
190
-
191
-
192
-
193
-
194
-
195
-
196
-
197
-
198
-
199
-
200
-
201
-
202
-
203
-
204
-
205
-
206
-
207
-
208
-
209
-
210
-
211
-
212
-
213
-
214
-
215
-
216
-
217
-
218
-
219
-
220
-
221
-
222
-
223
-
224
-
225
-
226
-
227
-
228
-
229
-
230
-
231
-
232
-
233
-
234
-
235
-
236
-
237
-
238
-
239
-
240
-
241
-
242
-
243
-
244
-
245
-
246
-
247
-
248
-
249
-
250
-
251
-
252
-
253
-
254
-
255
-
256
-
257
-
258
-
259
-
260
-
261
-
262
-
263
-
264
-
265
-
266
-
267
-
268
-
269
-
270
-
271
-
272
-
273
-
274
-
275
-
276
-
277
-
278
-
279
-
280
-
281
-
282
-
283
-
284
-
285
 |
 |

Table of Contents
directly sourced by distributors from Apple and accounted for as sales expense, partially offset by a reduction in commissions expense resulting from a shift in
channel mix combined with our decrease in subscriber gross additions. Point
-
of
-
sale discounts are included in the determination of equipment net subsidy when
we purchase and resell devices.
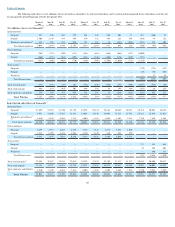
General and administrative costs were
$1.9 billion
for the Successor year ended
December 31, 2013
representing a decrease of
$2.1 billion
, or
53%
, as
compared to the Predecessor year ended
December 31, 2012
, primarily due to comparing operating results for the shortened Post
-
merger period to the
2012
Predecessor period consisting of a full calendar year, partially offset by additional IT and overhead costs as a result of the Clearwire Acquisition. Bad debt
expense was
$260 million
, a decrease of
$281 million
in the Successor period
2013
from the Predecessor year ended
December 31, 2012
, and
$541 million
, a
decrease of
$11 million
in
2012
from
2011
. The decrease is primarily related to comparing a shortened Post
-
merger period to the
2012
Predecessor period
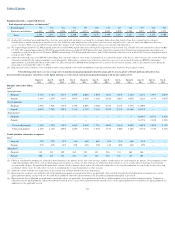
consisting of a full calendar year. We reassess our allowance for doubtful accounts quarterly. Changes in our allowance for doubtful accounts are largely
attributable to the analysis of historical collection experience and changes, if any, in credit policies established for subscribers. On the Sprint platform, the mix of
prime postpaid subscribers to total postpaid subscribers was
82%
,
81%
and
80%
as of
December 31, 2013
, 2012
and
2011
, respectively.
Combined Year Ended December 31, 2013 and Predecessor Year Ended December 31, 2012
In addition to the increases in the explanations above, the increase in sales and marketing expense for the combined year ended
December 31, 2013
as
compared to the Predecessor year ended
December 31, 2012
was also due to increased commissions expense resulting from growth in prepaid sales.
In addition to the explanations above, general and administrative costs decreased for the combined year ended
December 31, 2013
as compared to
the Predecessor year ended
December 31, 2012
also as a result of lower customer care costs primarily due to lower call volumes and fewer calls per subscriber. In
addition, the decrease in bad debt expense reflects a decrease in accounts written off, lower average write
-
off per account, and a decline in involuntary churn.
Segment Earnings
-
Wireline
We provide a broad suite of wireline voice and data communications services to other communications companies and targeted business and
consumer subscribers. In addition, we provide voice, data and IP communication services to our Wireless segment and IP and other services to cable MSOs.
Cable MSOs resell our local and long distance services and use our back office systems and network assets in support of their telephone service provided over
cable facilities primarily to residential end
-
use subscribers. We are one of the nation's largest providers of long distance services and operate all
-
digital global
long distance and Tier 1 IP networks. Our services and products include domestic and international data communications using various protocols such as
multiprotocol label switching technologies (MPLS), IP, managed network services, Voice over Internet Protocol (VoIP), Session Initiated Protocol (SIP), and
traditional voice services. Our IP services can also be combined with wireless services. Such services include our Sprint Mobile Integration service, which
enables a wireless handset to operate as part of a subscriber's wireline voice network, and our DataLink
SM
service, which uses our wireless networks to connect a
subscriber location into their primarily wireline wide
-
area IP/MPLS data network, making it easy for businesses to adapt their network to changing business
requirements. In addition to providing services to our business customers, the wireline network is carrying increasing amounts of voice and data traffic for our
Wireless segment as a result of growing usage by our wireless subscribers.
We continue to assess the portfolio of services provided by our Wireline business and are focusing our efforts on IP
-
based data services and de
-
emphasizing stand
-
alone voice services and non
-
IP
-
based data services. We also provide wholesale voice local and long distance services to cable MSOs,
which they offer as part of their bundled service offerings, as well as traditional voice and data services for their enterprise use. However, the digital voice
services we provide to our cable MSOs have become large enough in scale that they have decided to in
-
source these services and, as a result, we expect this
business to continue to decline over time. We also continue to provide voice services to residential consumers. Our Wireline segment markets and sells its
services primarily through direct sales representatives.
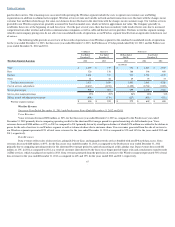
Wireline segment earnings are primarily a function of wireline service revenue, network and interconnection costs, and other Wireline segment
operating expenses. Network costs primarily represent special access costs and interconnection costs, which generally consist of domestic and international
per
-
minute usage fees
46