Sprint - Nextel 2013 Annual Report Download - page 51
Download and view the complete annual report
Please find page 51 of the 2013 Sprint - Nextel annual report below. You can navigate through the pages in the report by either clicking on the pages listed below, or by using the keyword search tool below to find specific information within the annual report.-
 1
1 -
2
-
3
-
4
-
5
-
6
-
7
-
8
-
9
-
10
-
11
-
12
-
13
-
14
-
15
-
16
-
17
-
18
-
19
-
20
-
21
-
22
-
23
-
24
-
25
-
26
-
27
-
28
-
29
-
30
-
31
-
32
-
33
-
34
-
35
-
36
-
37
-
38
-
39
-
40
-
 41
41 -
 42
42 -
 43
43 -
 44
44 -
 45
45 -
 46
46 -
 47
47 -
 48
48 -
 49
49 -
 50
50 -
 51
51 -
 52
52 -
 53
53 -
 54
54 -
 55
55 -
 56
56 -
 57
57 -
 58
58 -
 59
59 -
 60
60 -
 61
61 -
62
-
63
-
64
-
65
-
66
-
67
-
68
-
69
-
70
-
71
-
72
-
73
-
74
-
75
-
76
-
77
-
78
-
79
-
80
-
81
-
82
-
83
-
84
-
85
-
86
-
87
-
88
-
89
-
90
-
91
-
92
-
93
-
94
-
95
-
96
-
97
-
98
-
99
-
100
-
101
-
102
-
103
-
104
-
105
-
106
-
107
-
108
-
109
-
110
-
111
-
112
-
113
-
114
-
115
-
116
-
117
-
118
-
119
-
120
-
121
-
122
-
123
-
124
-
125
-
126
-
127
-
128
-
129
-
130
-
131
-
132
-
133
-
134
-
135
-
136
-
137
-
138
-
139
-
140
-
141
-
142
-
143
-
144
-
145
-
146
-
147
-
148
-
149
-
150
-
151
-
152
-
153
-
154
-
155
-
156
-
157
-
158
-
159
-
160
-
161
-
162
-
163
-
164
-
165
-
166
-
167
-
168
-
169
-
170
-
171
-
172
-
173
-
174
-
175
-
176
-
177
-
178
-
179
-
180
-
181
-
182
-
183
-
184
-
185
-
186
-
187
-
188
-
189
-
190
-
191
-
192
-
193
-
194
-
195
-
196
-
197
-
198
-
199
-
200
-
201
-
202
-
203
-
204
-
205
-
206
-
207
-
208
-
209
-
210
-
211
-
212
-
213
-
214
-
215
-
216
-
217
-
218
-
219
-
220
-
221
-
222
-
223
-
224
-
225
-
226
-
227
-
228
-
229
-
230
-
231
-
232
-
233
-
234
-
235
-
236
-
237
-
238
-
239
-
240
-
241
-
242
-
243
-
244
-
245
-
246
-
247
-
248
-
249
-
250
-
251
-
252
-
253
-
254
-
255
-
256
-
257
-
258
-
259
-
260
-
261
-
262
-
263
-
264
-
265
-
266
-
267
-
268
-
269
-
270
-
271
-
272
-
273
-
274
-
275
-
276
-
277
-
278
-
279
-
280
-
281
-
282
-
283
-
284
-
285
 |
 |
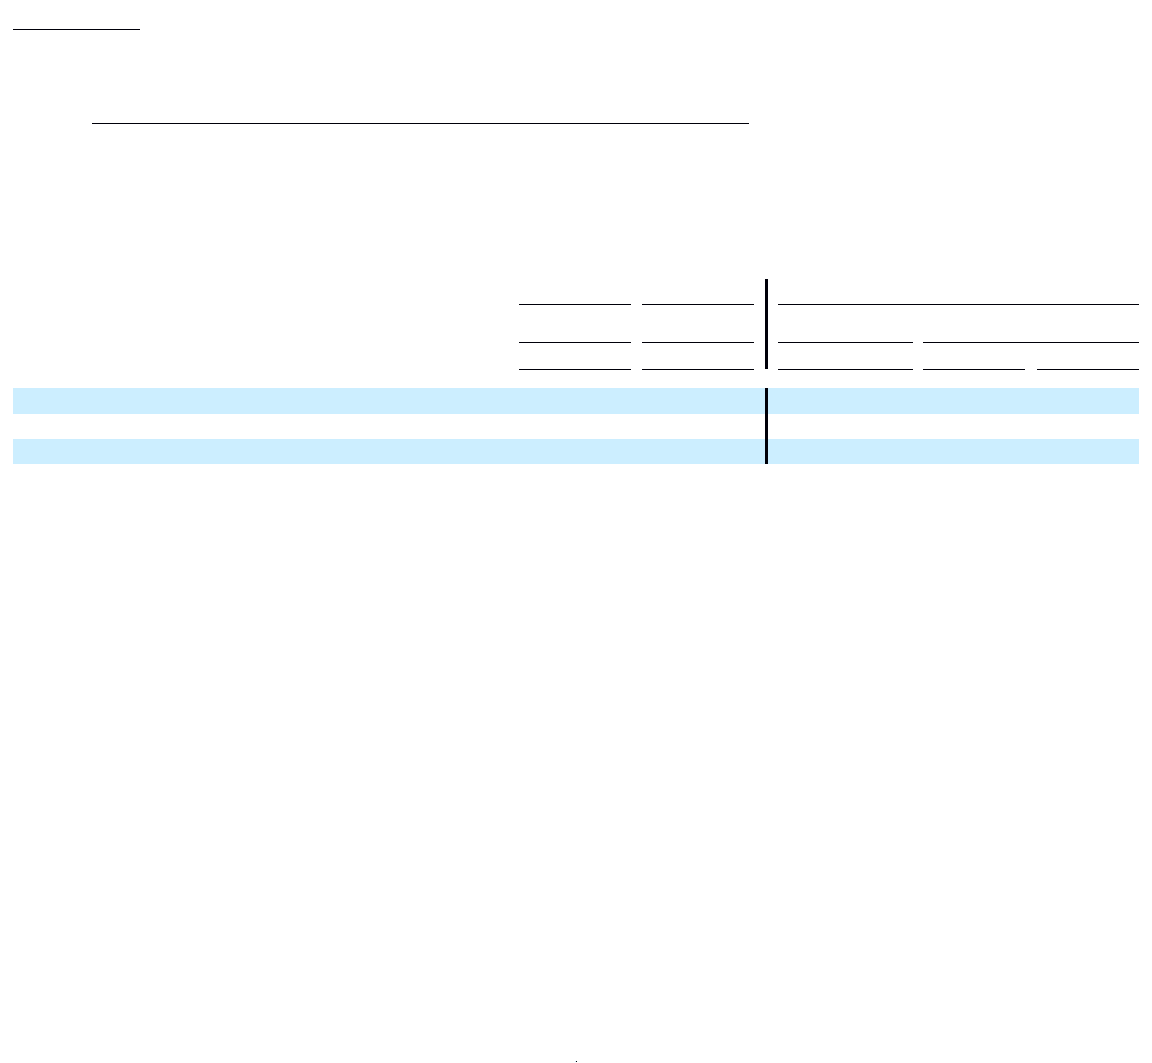
Table of Contents
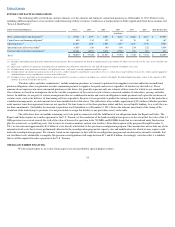
the decline in revenue. Total selling, general and administrative expense as a percentage of net services revenue was
11%
for the year ended
December 31, 2013
and
12%
in both the years ended
2012
and
2011.
Combined Year Ended December 31, 2013 and Predecessor Year Ended December 31, 2012
In addition to the explanations above, selling, general and administrative expense for the combined year ended
December 31, 2013
as compared to the
Predecessor period in
2012
decreased primarily due to a reduction in shared administrative and employee related costs required to support the Wireline segment
as a result of the decline in revenue.
LIQUIDITY AND CAPITAL RESOURCES
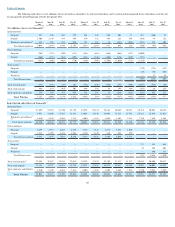
Cash Flow
Operating Activities
Net cash used in operating activities of approximately
$61 million
in
2013
for the Successor period decreased
$3.1 billion
from the same period in
2012
for the Predecessor. The decrease was primarily due to comparing a shortened Post
-
merger period to a period consisting of a full calendar year and also included
$180 million of call redemption premiums paid to retire the Clearwire debt and approximately $225 million of interest payments related to Clearwire debt. Net cash
provided by operating activities in
2013
, on a combined basis, of approximately
$2.6 billion
decreased $389 million as compared to the Predecessor in
2012
. In
addition to the explanations above, the decrease was primarily due to increased vendor and labor
-
related payments of $475 million and increased cash paid for
interest of approximately $213 million primarily as a result of less interest capitalized related to spectrum licenses used for our network modernization. This was
partially offset by increased cash received from customers of $699 million.
Net cash provided by operating activities of $3.0 billion in
2012
decreased $692 million from the same period in
2011
. The decrease resulted from
increases in vendor and labor
-
related payments of $1.5 billion, which primarily related to an increase in the average cost of postpaid and prepaid devices sold
and increased cash paid for interest of $339 million primarily due to an increase in the weighted average long
-
term debt balance and effective interest rate. This
was partially offset by increased cash received from customers of $1.1 billion primarily due to increases in postpaid ARPU and total net subscribers. Included in
our vendor and labor related payments was $108 million in pension contribution payments made during
2012.
Investing Activities
Net cash used in investing activities for the Successor period increased by approximately
$11.7 billion
as compared to the related Predecessor period,
primarily due to increased cash paid related to the SoftBank Merger of $14.1 billion, net of cash acquired. This increase was partially offset by decreased
purchases of short
-
term investments of approximately $1.5 billion, increased proceeds of approximately $200 million from sales and maturities of short
-
term
investments and a reduction in capital expenditures of approximately $400 million as a result of comparing a shortened Post
-
merger period to a period consisting
of a full calendar year.
Net cash used in investing activities for
2012
increased by $2.9 billion from
2011
, primarily due to increases of $2.4 billion in purchases of short
-
term
investments and $1.1 billion in capital expenditures, partially offset by an increase of $533 million in proceeds from sales and maturities of short
-
term
investments. Increases in capital expenditures were primarily related to spend for our network modernization, partially offset by reductions to legacy equipment
spend. We also recognized $128 million in the form of a note receivable from Clearwire in 2012 as a result of the additional investment provided in the fourth
quarter 2011. In addition, we purchased Clearwire
49
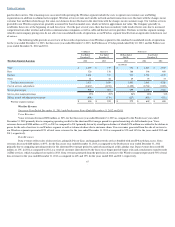
Combined
Successor
Predecessor
Year Ended
December 31,
Year Ended
December 31,
191 Days Ended
July 10,
Years Ended
December 31,
2013
2013
2013
2012
2011
(in millions)
Net cash provided by (used in) operating activities
$
2,610
$
(61
)
$
2,671
$
2,999
$
3,691
Net cash used in investing activities
$
(24,493
)
$
(18,108
)
$
(6,385
)
$
(6,375
)
$
(3,443
)
Net cash provided by (used in) financing activities
$
24,419
$
24,528
$
(109
)
$
4,280
$
26