Sprint - Nextel 2013 Annual Report Download - page 46
Download and view the complete annual report
Please find page 46 of the 2013 Sprint - Nextel annual report below. You can navigate through the pages in the report by either clicking on the pages listed below, or by using the keyword search tool below to find specific information within the annual report.-
 1
1 -
2
-
3
-
4
-
5
-
6
-
7
-
8
-
9
-
10
-
11
-
12
-
13
-
14
-
15
-
16
-
17
-
18
-
19
-
20
-
21
-
22
-
23
-
24
-
25
-
26
-
27
-
28
-
29
-
30
-
31
-
32
-
33
-
34
-
35
-
 36
36 -
 37
37 -
 38
38 -
 39
39 -
 40
40 -
 41
41 -
 42
42 -
 43
43 -
 44
44 -
 45
45 -
 46
46 -
 47
47 -
 48
48 -
 49
49 -
 50
50 -
 51
51 -
 52
52 -
 53
53 -
 54
54 -
 55
55 -
 56
56 -
57
-
58
-
59
-
60
-
61
-
62
-
63
-
64
-
65
-
66
-
67
-
68
-
69
-
70
-
71
-
72
-
73
-
74
-
75
-
76
-
77
-
78
-
79
-
80
-
81
-
82
-
83
-
84
-
85
-
86
-
87
-
88
-
89
-
90
-
91
-
92
-
93
-
94
-
95
-
96
-
97
-
98
-
99
-
100
-
101
-
102
-
103
-
104
-
105
-
106
-
107
-
108
-
109
-
110
-
111
-
112
-
113
-
114
-
115
-
116
-
117
-
118
-
119
-
120
-
121
-
122
-
123
-
124
-
125
-
126
-
127
-
128
-
129
-
130
-
131
-
132
-
133
-
134
-
135
-
136
-
137
-
138
-
139
-
140
-
141
-
142
-
143
-
144
-
145
-
146
-
147
-
148
-
149
-
150
-
151
-
152
-
153
-
154
-
155
-
156
-
157
-
158
-
159
-
160
-
161
-
162
-
163
-
164
-
165
-
166
-
167
-
168
-
169
-
170
-
171
-
172
-
173
-
174
-
175
-
176
-
177
-
178
-
179
-
180
-
181
-
182
-
183
-
184
-
185
-
186
-
187
-
188
-
189
-
190
-
191
-
192
-
193
-
194
-
195
-
196
-
197
-
198
-
199
-
200
-
201
-
202
-
203
-
204
-
205
-
206
-
207
-
208
-
209
-
210
-
211
-
212
-
213
-
214
-
215
-
216
-
217
-
218
-
219
-
220
-
221
-
222
-
223
-
224
-
225
-
226
-
227
-
228
-
229
-
230
-
231
-
232
-
233
-
234
-
235
-
236
-
237
-
238
-
239
-
240
-
241
-
242
-
243
-
244
-
245
-
246
-
247
-
248
-
249
-
250
-
251
-
252
-
253
-
254
-
255
-
256
-
257
-
258
-
259
-
260
-
261
-
262
-
263
-
264
-
265
-
266
-
267
-
268
-
269
-
270
-
271
-
272
-
273
-
274
-
275
-
276
-
277
-
278
-
279
-
280
-
281
-
282
-
283
-
284
-
285
 |
 |

Table of Contents
in Retail Prepaid above, partially offset by increases in connected devices and growth in wholesale postpaid resellers.
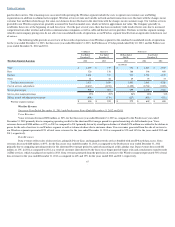
Transactions Subscribers
As part of the acquisition of assets from U.S. Cellular, which closed in May 2013, we acquired 352,000 postpaid subscribers and 59,000 prepaid
subscribers. As part of the Clearwire Acquisition in July 2013, we acquired
788,000
postpaid subscribers (exclusive of Sprint platform wholesale subscribers
acquired through our MVNO relationship with Clearwire that were transferred to postpaid subscribers within Transactions),
721,000
prepaid subscribers, and
93,000
wholesale subscribers. For the remainder of the year ended
December 31, 2013
, we had net postpaid subscriber losses of
481,000
, net prepaid subscriber
losses of
179,000
and net wholesale subscriber additions of
38,000
, of which approximately
106,000
and
8,000
postpaid and prepaid subscribers, respectively,
were recaptured on the Sprint platform.
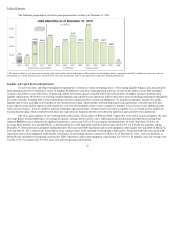
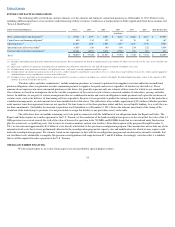
Cost of Services
Cost of services consists primarily of:
Successor Year Ended December 31, 2013 and Predecessor Years Ended December 31, 2012 and 2011
Cost of services decreased
$4.7 billion
, or
52%
, for the Successor year ended
December 31, 2013
, as compared to the Predecessor year ended
December 31, 2012
, primarily due to comparing operating results for the shortened Post
-
merger period to the
2012
Predecessor period consisting of a full
calendar year. In addition, we had reduced network costs such as rent and utilities in 2013 as a result of the shut
-
down of the Nextel platform in June 2013
combined with a decrease in service and repair costs due to a decline in the volume and frequency of repairs. These decreases were partially offset by additional
network costs due to the modernization of our network as well as the net impact of the Clearwire Acquisition.
Cost of services increased
$110 million
, or 1%
, in
2012
compared to 2011, reflecting an increase in rent expense primarily due to the cell site leases
renegotiated in 2011 in connection with our network modernization and the shutdown of the Nextel platform and higher backhaul costs primarily due to
increased capacity. These increases were partially offset by a decrease in payments to third
-
party vendors for use of their proprietary data applications and
premium services as a result of more favorable rates provided by contract renegotiations and a decline in long distance network costs as a result of lower market
rates. In addition, service and repair costs decreased due to a decline in the volume and frequency of repairs, which was slightly offset by an increase in the cost
per unit of devices utilized for service and repair due to the growth in smartphone popularity.
Combined Year Ended December 31, 2013 and Predecessor Year Ended December 31, 2012
In addition to the explanations above, cost of services for the combined year ended
December 31, 2013
as compared to the Predecessor year ended
December 31, 2012
decreased as a result of a reduction in payments to third
-
party vendors for use of their proprietary data applications and premium services as
a result of more favorable contract rates. These decreases were partially offset by higher backhaul costs primarily due to increased capacity.
44
•
costs to operate and maintain our networks, including direct switch and cell site costs, such as rent, utilities, maintenance, labor costs
associated with network employees, and spectrum frequency leasing costs;
•
fixed and variable interconnection costs, the fixed component of which consists of monthly flat
-
rate fees for facilities leased from local
exchange carriers based on the number of cell sites and switches in service in a particular period and the related equipment installed at each
site, and the variable component of which generally consists of per
-
minute use fees charged by wireline providers for calls terminating on their
networks, which fluctuate in relation to the level and duration of those terminating calls;
•
long distance costs paid to the Wireline segment;
•
costs to service and repair devices;
•
regulatory fees;
•
roaming fees paid to other carriers; and
•
fixed and variable costs relating to payments to third parties for the use of their proprietary data applications, such as messaging, music, TV,
and navigation services by our subscribers.