Sprint - Nextel 2013 Annual Report Download - page 36
Download and view the complete annual report
Please find page 36 of the 2013 Sprint - Nextel annual report below. You can navigate through the pages in the report by either clicking on the pages listed below, or by using the keyword search tool below to find specific information within the annual report.-
 1
1 -
2
-
3
-
4
-
5
-
6
-
7
-
8
-
9
-
10
-
11
-
12
-
13
-
14
-
15
-
16
-
17
-
18
-
19
-
20
-
21
-
22
-
23
-
24
-
25
-
 26
26 -
 27
27 -
 28
28 -
 29
29 -
 30
30 -
 31
31 -
 32
32 -
 33
33 -
 34
34 -
 35
35 -
 36
36 -
 37
37 -
 38
38 -
 39
39 -
 40
40 -
 41
41 -
 42
42 -
 43
43 -
 44
44 -
 45
45 -
 46
46 -
47
-
48
-
49
-
50
-
51
-
52
-
53
-
54
-
55
-
56
-
57
-
58
-
59
-
60
-
61
-
62
-
63
-
64
-
65
-
66
-
67
-
68
-
69
-
70
-
71
-
72
-
73
-
74
-
75
-
76
-
77
-
78
-
79
-
80
-
81
-
82
-
83
-
84
-
85
-
86
-
87
-
88
-
89
-
90
-
91
-
92
-
93
-
94
-
95
-
96
-
97
-
98
-
99
-
100
-
101
-
102
-
103
-
104
-
105
-
106
-
107
-
108
-
109
-
110
-
111
-
112
-
113
-
114
-
115
-
116
-
117
-
118
-
119
-
120
-
121
-
122
-
123
-
124
-
125
-
126
-
127
-
128
-
129
-
130
-
131
-
132
-
133
-
134
-
135
-
136
-
137
-
138
-
139
-
140
-
141
-
142
-
143
-
144
-
145
-
146
-
147
-
148
-
149
-
150
-
151
-
152
-
153
-
154
-
155
-
156
-
157
-
158
-
159
-
160
-
161
-
162
-
163
-
164
-
165
-
166
-
167
-
168
-
169
-
170
-
171
-
172
-
173
-
174
-
175
-
176
-
177
-
178
-
179
-
180
-
181
-
182
-
183
-
184
-
185
-
186
-
187
-
188
-
189
-
190
-
191
-
192
-
193
-
194
-
195
-
196
-
197
-
198
-
199
-
200
-
201
-
202
-
203
-
204
-
205
-
206
-
207
-
208
-
209
-
210
-
211
-
212
-
213
-
214
-
215
-
216
-
217
-
218
-
219
-
220
-
221
-
222
-
223
-
224
-
225
-
226
-
227
-
228
-
229
-
230
-
231
-
232
-
233
-
234
-
235
-
236
-
237
-
238
-
239
-
240
-
241
-
242
-
243
-
244
-
245
-
246
-
247
-
248
-
249
-
250
-
251
-
252
-
253
-
254
-
255
-
256
-
257
-
258
-
259
-
260
-
261
-
262
-
263
-
264
-
265
-
266
-
267
-
268
-
269
-
270
-
271
-
272
-
273
-
274
-
275
-
276
-
277
-
278
-
279
-
280
-
281
-
282
-
283
-
284
-
285
 |
 |

Table of Contents
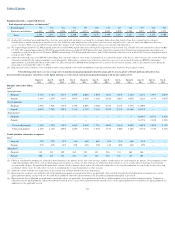
and exit costs associated with actions taken in the fourth quarter 2011 and $78 million of asset impairments primarily related to assets that are no longer
necessary for management's strategic plans and were primarily related to network asset equipment.
Gains from asset dispositions and exchanges in 2012 were primarily related to spectrum exchange transactions. The spectrum hosting contract
termination in 2012 was due to the recognition of
$236 million
of the total
$310 million
paid by LightSquared in 2011 as operating income in "Other, net" due to
the termination of our spectrum hosting arrangement with LiqhtSquared.
The
$93 million
reflected in "Other" for the Successor year ended
December 31, 2013
included $100 million of business combination fees paid to
unrelated parties in connection with the transactions with SoftBank and Clearwire and are classified within selling, general and administrative expense in our
consolidated statement of comprehensive income (loss). This is partially offset by $7 million of reimbursements related to 2012 hurricane
-
related charges
recorded as a contra expense in cost of services in our consolidated statement of comprehensive income (loss). The amount reflected in "Other" for 2012
consisted of $45 million of hurricane
-
related costs and $19 million of expenses associated with business combinations partially offset by $17 million in benefits
resulting from favorable developments relating to access cost disputes with certain exchange carriers.
Predecessor Period of 191 Days Ended July 10, 2013
Exit costs in the Predecessor 191
-
day period ended July 10, 2013 included lease exit costs of $478 million primarily associated with taking certain
Nextel platform sites off
-
air by June 30, 2013 and $151 million related to payments that will continue to be made under our backhaul access contracts for which
we will no longer be receiving any economic benefit. Of the $151 million of future payments, $35 million was recognized as "Cost of services and products" and
$116 million (solely attributable to Wireless) was recognized in "Severance, exit costs and asset impairments." We also recognized $58 million of severance
related to reductions in force in the Predecessor 191
-
day period ended July 10, 2013. "Other" for the Predecessor 191
-
day period ended July 10, 2013 included
$53 million of business combination fees paid to unrelated parties as described above, partially offset by a favorable ruling by the Texas Supreme Court in
connection with the taxation of E911 services, which resulted in a non
-
cash benefit of $22 million.
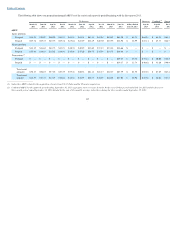
Interest Expense
Successor Year Ended December 31, 2013 and Predecessor Years Ended December 31, 2012 and 2011
Interest expense decreased
$510 million
, or
36%
, for the Successor year ended
December 31, 2013
as compared to the Predecessor year ended
December 31, 2012
. The decrease was primarily due to comparing a shortened Post
-
merger period to a Predecessor period representing a full calendar year. This
decrease was partially offset by interest expense increases as a result of the debt assumed in the Clearwire Acquisition and new debt issuances in September
and December 2013. See "Liquidity and Capital Resources" for more information on the Company's financing activities.
Taking into account the Clearwire and SoftBank transactions, the Company's consolidated debt balance was approximately
$33.0 billion
as of
December 31, 2013
. The effective interest rate, which includes capitalized interest, for the Combined year ended
December 31, 2013
was 7.7% based on a
weighted average long
-
term debt balance of $27.5 billion. The effective interest rate, which includes capitalized interest, on the weighted average long
-
term debt
balances of $22.0 billion and $19.1 billion was 7.8% and 7.4% for the Predecessor years ended 2012 and 2011, respectively. See "Liquidity and Capital
Resources" for more information on the Company's financing activities.
Interest expense increased $417 million, or 41%, in 2012 as compared to 2011, primarily due to increased weighted average long
-
term debt balances as
a result of 2011 and 2012 debt issuances, partially offset by 2011 and 2012 debt repayments, in addition to increased effective interest rates combined with
reductions in the amount of interest capitalized primarily related to spectrum licenses.
Combined Year Ended December 31, 2013 and Predecessor Year Ended December 31, 2012
In addition to the explanations above, the interest expense increase for the combined year ended
December 31, 2013
as compared to the Predecessor
year ended
December 31, 2012
was partially due to reductions in the amount of interest capitalized related to spectrum licenses.
34