Sprint - Nextel 2013 Annual Report Download - page 35
Download and view the complete annual report
Please find page 35 of the 2013 Sprint - Nextel annual report below. You can navigate through the pages in the report by either clicking on the pages listed below, or by using the keyword search tool below to find specific information within the annual report.-
 1
1 -
2
-
3
-
4
-
5
-
6
-
7
-
8
-
9
-
10
-
11
-
12
-
13
-
14
-
15
-
16
-
17
-
18
-
19
-
20
-
21
-
22
-
23
-
24
-
 25
25 -
 26
26 -
 27
27 -
 28
28 -
 29
29 -
 30
30 -
 31
31 -
 32
32 -
 33
33 -
 34
34 -
 35
35 -
 36
36 -
 37
37 -
 38
38 -
 39
39 -
 40
40 -
 41
41 -
 42
42 -
 43
43 -
 44
44 -
 45
45 -
46
-
47
-
48
-
49
-
50
-
51
-
52
-
53
-
54
-
55
-
56
-
57
-
58
-
59
-
60
-
61
-
62
-
63
-
64
-
65
-
66
-
67
-
68
-
69
-
70
-
71
-
72
-
73
-
74
-
75
-
76
-
77
-
78
-
79
-
80
-
81
-
82
-
83
-
84
-
85
-
86
-
87
-
88
-
89
-
90
-
91
-
92
-
93
-
94
-
95
-
96
-
97
-
98
-
99
-
100
-
101
-
102
-
103
-
104
-
105
-
106
-
107
-
108
-
109
-
110
-
111
-
112
-
113
-
114
-
115
-
116
-
117
-
118
-
119
-
120
-
121
-
122
-
123
-
124
-
125
-
126
-
127
-
128
-
129
-
130
-
131
-
132
-
133
-
134
-
135
-
136
-
137
-
138
-
139
-
140
-
141
-
142
-
143
-
144
-
145
-
146
-
147
-
148
-
149
-
150
-
151
-
152
-
153
-
154
-
155
-
156
-
157
-
158
-
159
-
160
-
161
-
162
-
163
-
164
-
165
-
166
-
167
-
168
-
169
-
170
-
171
-
172
-
173
-
174
-
175
-
176
-
177
-
178
-
179
-
180
-
181
-
182
-
183
-
184
-
185
-
186
-
187
-
188
-
189
-
190
-
191
-
192
-
193
-
194
-
195
-
196
-
197
-
198
-
199
-
200
-
201
-
202
-
203
-
204
-
205
-
206
-
207
-
208
-
209
-
210
-
211
-
212
-
213
-
214
-
215
-
216
-
217
-
218
-
219
-
220
-
221
-
222
-
223
-
224
-
225
-
226
-
227
-
228
-
229
-
230
-
231
-
232
-
233
-
234
-
235
-
236
-
237
-
238
-
239
-
240
-
241
-
242
-
243
-
244
-
245
-
246
-
247
-
248
-
249
-
250
-
251
-
252
-
253
-
254
-
255
-
256
-
257
-
258
-
259
-
260
-
261
-
262
-
263
-
264
-
265
-
266
-
267
-
268
-
269
-
270
-
271
-
272
-
273
-
274
-
275
-
276
-
277
-
278
-
279
-
280
-
281
-
282
-
283
-
284
-
285
 |
 |

Table of Contents
initiatives was approximately
$2.1 billion
, of which the majority related to the shut
-
down of the Nextel platform. The increase related to accelerated depreciation
was slightly offset by a net decrease in depreciation as a result of assets that became fully depreciated or were retired.
Combined Year Ended December 31, 2013 and Predecessor Year Ended December 31, 2012
In addition to the explanations above, the decrease in depreciation expense for the combined year ended
December 31, 2013
as compared to the
Predecessor year ended
December 31, 2012
was partially offset by increased depreciation expense primarily due to network asset additions in the Predecessor
191
-
day period. The incremental effect of accelerated depreciation expense totaled approximately $800 million for the 191 days ended July 10, 2013, which was
primarily related to the shut
-
down of the Nextel platform on June 30, 2013.
Amortization Expense
Successor Year Ended December 31, 2013 and Predecessor Years Ended December 31, 2012 and 2011
Amortization expense increased
$605 million
, or
200%
, for the Successor year ended
December 31, 2013
as compared to the Predecessor year ended
December 31, 2012
, primarily due to the recognition of definite
-
lived intangible assets related to customer relationships of approximately $6.9 billion as a result of
the SoftBank Merger. Customer relationship intangible assets are amortized using the sum
-
of
-
the
-
months'
-
digits method, which results in higher amortization
rates in early periods that will decline over time.
Amortization expense declined $100 million, or 25%, in 2012 compared to 2011 primarily due to the absence of amortization for customer relationship
intangible assets related to the 2006 acquisition of Nextel Partners, Inc. and the 2009 acquisition of Virgin Mobile USA, Inc., which became fully amortized in the
second quarter 2011.
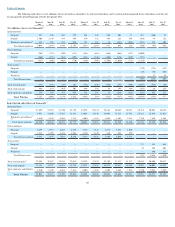
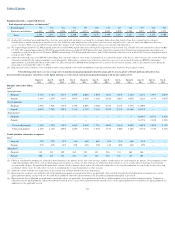
Other, net
The following table provides additional information of items included in "Other, net" for the combined consolidated results of operations for the year
ended
December 31, 2013
, the Successor year ended
December 31, 2013
, the Predecessor 191
-
day period ended July 10, 2013, and the Predecessor years ended
December 31, 2012
and
2011.
Successor Year Ended December 31, 2013 and Predecessor Years Ended December 31, 2012 and 2011
"Other, net" represented an expense of
$402 million
for the Successor year ended
December 31, 2013
and an expense of
$80 million
and
$106 million
in
the Predecessor years ended
December 31, 2012
and
2011
, respectively. Severance, exit costs, and asset impairments of
$309 million
for the Successor year
ended
December 31, 2013
included
$219 million
of severance primarily associated with reductions in force and
$56 million
of lease exit costs primarily associated
with the decommissioning of the Nextel platform. In addition, we recognized
$53 million
of payments that will continue to be made under our backhaul access
contracts for which we will no longer be receiving any economic benefit, and of which
$19 million
was recognized as "Cost of services and products."
Severance, exit costs, and asset impairments in
2012
included lease exit costs of $196 million associated with taking certain Nextel platform sites off
-
air in the
second and third quarter 2012 and asset impairments, consisting of
$18 million
of assets associated with a decision to utilize fiber backhaul rather than
microwave backhaul and
$66 million
of capitalized assets that we no longer intend to deploy as a result of the termination of the spectrum hosting arrangement
with LightSquared. In addition, we had asset impairments of $18 million in 2012 primarily related to assets that are no longer necessary for management's
strategic plans and were primarily related to network asset equipment. Severance, exit costs, and asset impairments in
2011
included $28 million of severance
33
Combined
Successor
Predecessor
Year Ended
December 31,
Year Ended
December 31,
191 Days Ended
July 10,
Years Ended
December 31,
2013
2013
2013
2012
2011
(in millions)
Severance, exit costs and asset impairments
$
(961
)
$
(309
)
$
(652
)
$
(298
)
$
(106
)
Spectrum hosting contract termination
—
—
—
236
—
Gains from asset dispositions and exchanges
—
—
—
29
—
Other
(124
)
(93
)
(31
)
(47
)
—
Total
$
(1,085
)
$
(402
)
$
(683
)
$
(80
)
$
(106
)