Sprint - Nextel 2013 Annual Report Download - page 50
Download and view the complete annual report
Please find page 50 of the 2013 Sprint - Nextel annual report below. You can navigate through the pages in the report by either clicking on the pages listed below, or by using the keyword search tool below to find specific information within the annual report.-
 1
1 -
2
-
3
-
4
-
5
-
6
-
7
-
8
-
9
-
10
-
11
-
12
-
13
-
14
-
15
-
16
-
17
-
18
-
19
-
20
-
21
-
22
-
23
-
24
-
25
-
26
-
27
-
28
-
29
-
30
-
31
-
32
-
33
-
34
-
35
-
36
-
37
-
38
-
39
-
 40
40 -
 41
41 -
 42
42 -
 43
43 -
 44
44 -
 45
45 -
 46
46 -
 47
47 -
 48
48 -
 49
49 -
 50
50 -
 51
51 -
 52
52 -
 53
53 -
 54
54 -
 55
55 -
 56
56 -
 57
57 -
 58
58 -
 59
59 -
 60
60 -
61
-
62
-
63
-
64
-
65
-
66
-
67
-
68
-
69
-
70
-
71
-
72
-
73
-
74
-
75
-
76
-
77
-
78
-
79
-
80
-
81
-
82
-
83
-
84
-
85
-
86
-
87
-
88
-
89
-
90
-
91
-
92
-
93
-
94
-
95
-
96
-
97
-
98
-
99
-
100
-
101
-
102
-
103
-
104
-
105
-
106
-
107
-
108
-
109
-
110
-
111
-
112
-
113
-
114
-
115
-
116
-
117
-
118
-
119
-
120
-
121
-
122
-
123
-
124
-
125
-
126
-
127
-
128
-
129
-
130
-
131
-
132
-
133
-
134
-
135
-
136
-
137
-
138
-
139
-
140
-
141
-
142
-
143
-
144
-
145
-
146
-
147
-
148
-
149
-
150
-
151
-
152
-
153
-
154
-
155
-
156
-
157
-
158
-
159
-
160
-
161
-
162
-
163
-
164
-
165
-
166
-
167
-
168
-
169
-
170
-
171
-
172
-
173
-
174
-
175
-
176
-
177
-
178
-
179
-
180
-
181
-
182
-
183
-
184
-
185
-
186
-
187
-
188
-
189
-
190
-
191
-
192
-
193
-
194
-
195
-
196
-
197
-
198
-
199
-
200
-
201
-
202
-
203
-
204
-
205
-
206
-
207
-
208
-
209
-
210
-
211
-
212
-
213
-
214
-
215
-
216
-
217
-
218
-
219
-
220
-
221
-
222
-
223
-
224
-
225
-
226
-
227
-
228
-
229
-
230
-
231
-
232
-
233
-
234
-
235
-
236
-
237
-
238
-
239
-
240
-
241
-
242
-
243
-
244
-
245
-
246
-
247
-
248
-
249
-
250
-
251
-
252
-
253
-
254
-
255
-
256
-
257
-
258
-
259
-
260
-
261
-
262
-
263
-
264
-
265
-
266
-
267
-
268
-
269
-
270
-
271
-
272
-
273
-
274
-
275
-
276
-
277
-
278
-
279
-
280
-
281
-
282
-
283
-
284
-
285
 |
 |

Table of Contents
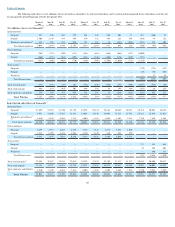
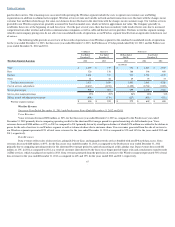
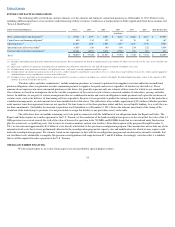
Internet Revenue
IP
-
based data services revenue reflects sales of Internet services, including MPLS, VoIP, SIP, and managed services bundled with IP
-
based data
access. IP
-
based data services decreased
$1.0 billion
, or
58%
, for the Successor year ended
December 31, 2013
as compared to the Predecessor year ended
December 31, 2012
primarily due to comparing operating results for the shortened Post
-
merger period to a period consisting of a full calendar year. IP
-
based data
services decreased
$97 million
, or 5%
, in
2012
as compared to
2011
primarily due to the in
-
sourcing of digital voice products by certain cable MSOs. Sale of
services to our Wireless segment represented
11%
of total Internet revenues for both the years ended
December 31, 2013
and
2012
and 8% for the year ended
December 31, 2011
.
Other Revenues
Other revenues, which primarily consist of sales of customer premises equipment, decreased
$43 million
, or
57%
in the Successor year ended
December 31, 2013
as compared to the Predecessor year ended
December 31, 2012
, primarily due to comparing operating results for the shortened Post
-
merger
period to a period consisting of a full calendar year. Other revenues increased
$2 million
, or 3%
, in
2012
as compared to
2011.
Combined Year Ended December 31, 2013 and Predecessor Year Ended December 31, 2012
Voice Revenues
In addition to the explanations above, voice revenues for the combined year ended
December 31, 2013
as compared to the Predecessor year ended
December 31, 2012
decreased as a result of overall volume and price declines, of which $53 million was related to the decline in prices for the sale of services to
our Wireless segment, as well as volume declines due to customer churn.
Data Revenues
In addition to the explanations above, data revenues for the combined year ended
December 31, 2013
as compared to the Predecessor year ended
December 31, 2012
decreased as a result of customer churn driven by the focus to no longer provide frame relay and ATM services.
Internet Revenue
In addition to the explanations above, Internet revenues for the combined year ended
December 31, 2013
as compared to the Predecessor year ended
December 31, 2012
decreased primarily due to fewer IP customers.
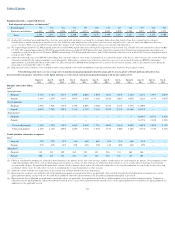
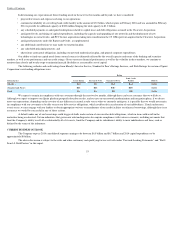
Costs of Services and Products
Successor Year Ended December 31, 2013 and Predecessor Years Ended December 31, 2012 and 2011
Costs of services and products include access costs paid to local phone companies, other domestic service providers and foreign phone companies
to complete calls made by our domestic subscribers, costs to operate and maintain our networks, and costs of equipment. Costs of services and products
decreased
$1.5 billion
, or
56%
, in the Successor year ended
December 31, 2013
as compared to the Predecessor year ended
December 31, 2012
primarily due to
comparing operating results for the shortened Post
-
merger period to a period consisting of a full calendar year. Costs of services and products decreased
$224
million
, or 7%
, in
2012
from
2011
primarily due to lower access expense as a result of savings initiatives and declining voice, data and Internet volumes. Service
gross margin percentage decreased from
31%
in
2011
to
28%
in
2012
and to
25%
in
2013
, primarily as a result of a decrease in net service revenue partially offset
by a decrease in cost of services and products.
Combined Year Ended December 31, 2013 and Predecessor Year Ended December 31, 2012
In addition to the explanations above, costs of services and products for the combined year ended
December 31, 2013
as compared to the
Predecessor year ended
December 31, 2012
decreased primarily due to lower access expense as a result of declining voice, data and Internet volumes.
Selling, General and Administrative Expense
Successor Year Ended December 31, 2013 and Predecessor Years Ended December 31, 2012 and 2011
Selling, general and administrative expense decreased
$272 million
, or
60%
, in the Successor year ended
December 31, 2013
, as compared to the
Predecessor year ended
December 31, 2012
, primarily due to comparing operating results for the shortened Post
-
merger period to a period consisting of a full
calendar year. Selling, general and administrative expense decreased
$70 million
, or
13%
, in
2012
as compared to 2011 primarily due to a reduction in shared
administrative and employee related costs required to support the Wireline segment as a result of
48