Sprint - Nextel 2013 Annual Report Download - page 175
Download and view the complete annual report
Please find page 175 of the 2013 Sprint - Nextel annual report below. You can navigate through the pages in the report by either clicking on the pages listed below, or by using the keyword search tool below to find specific information within the annual report.-
 1
1 -
2
-
3
-
4
-
5
-
6
-
7
-
8
-
9
-
10
-
11
-
12
-
13
-
14
-
15
-
16
-
17
-
18
-
19
-
20
-
21
-
22
-
23
-
24
-
25
-
26
-
27
-
28
-
29
-
30
-
31
-
32
-
33
-
34
-
35
-
36
-
37
-
38
-
39
-
40
-
41
-
42
-
43
-
44
-
45
-
46
-
47
-
48
-
49
-
50
-
51
-
52
-
53
-
54
-
55
-
56
-
57
-
58
-
59
-
60
-
61
-
62
-
63
-
64
-
65
-
66
-
67
-
68
-
69
-
70
-
71
-
72
-
73
-
74
-
75
-
76
-
77
-
78
-
79
-
80
-
81
-
82
-
83
-
84
-
85
-
86
-
87
-
88
-
89
-
90
-
91
-
92
-
93
-
94
-
95
-
96
-
97
-
98
-
99
-
100
-
101
-
102
-
103
-
104
-
105
-
106
-
107
-
108
-
109
-
110
-
111
-
112
-
113
-
114
-
115
-
116
-
117
-
118
-
119
-
120
-
121
-
122
-
123
-
124
-
125
-
126
-
127
-
128
-
129
-
130
-
131
-
132
-
133
-
134
-
135
-
136
-
137
-
138
-
139
-
140
-
141
-
142
-
143
-
144
-
145
-
146
-
147
-
148
-
149
-
150
-
151
-
152
-
153
-
154
-
155
-
156
-
157
-
158
-
159
-
160
-
161
-
162
-
163
-
164
-
 165
165 -
 166
166 -
 167
167 -
 168
168 -
 169
169 -
 170
170 -
 171
171 -
 172
172 -
 173
173 -
 174
174 -
 175
175 -
 176
176 -
 177
177 -
 178
178 -
 179
179 -
 180
180 -
 181
181 -
 182
182 -
 183
183 -
 184
184 -
 185
185 -
186
-
187
-
188
-
189
-
190
-
191
-
192
-
193
-
194
-
195
-
196
-
197
-
198
-
199
-
200
-
201
-
202
-
203
-
204
-
205
-
206
-
207
-
208
-
209
-
210
-
211
-
212
-
213
-
214
-
215
-
216
-
217
-
218
-
219
-
220
-
221
-
222
-
223
-
224
-
225
-
226
-
227
-
228
-
229
-
230
-
231
-
232
-
233
-
234
-
235
-
236
-
237
-
238
-
239
-
240
-
241
-
242
-
243
-
244
-
245
-
246
-
247
-
248
-
249
-
250
-
251
-
252
-
253
-
254
-
255
-
256
-
257
-
258
-
259
-
260
-
261
-
262
-
263
-
264
-
265
-
266
-
267
-
268
-
269
-
270
-
271
-
272
-
273
-
274
-
275
-
276
-
277
-
278
-
279
-
280
-
281
-
282
-
283
-
284
-
285
 |
 |

Table of Contents
Index to Consolidated Financial Statements
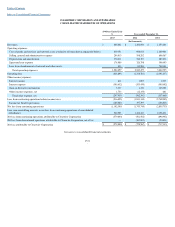
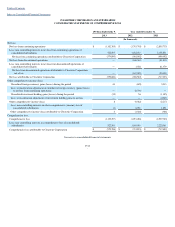
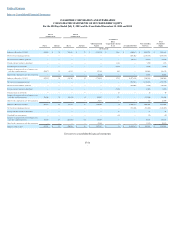
CLEARWIRE CORPORATION AND SUBSIDIARIES
CONSOLIDATED STATEMENTS OF STOCKHOLDERS
’
EQUITY
For the 190 Days Ended
July 9, 2013
and the Years Ended
December 31, 2012
and
2011
See notes to consolidated financial statements
F
-
54
Class A
Common Stock
Class B
Common Stock
Shares
Amounts
Shares
Amounts
Additional Paid In
Capital
Accumulated
Other
Comprehensive Income
(Loss)
Accumulated Deficit
Non-controlling
Interests
Total
Stockholders
’
Equity
(In thousands)
Balances at December 31, 2010
243,544
$
24
743,481
$
74
$
2,221,110
$
2,495
$
(900,493
)
$
4,546,788
$
5,869,998
Net loss from continuing operations
—
—
—
—
—
—
(696,902
)
(2,158,831
)
(2,855,733
)
Net loss from discontinued operations
—
—
—
—
—
—
(20,431
)
(61,379
)
(81,810
)
Foreign currency translation adjustment
—
—
—
—
—
1,149
—
2,764
3,913
Unrealized gain on investments
—
—
—
—
—
(1,515
)
—
(4,615
)
(6,130
)
Issuance of common stock, net of issuance costs,
and other capital transactions
208,671
21
96,222
9
478,394
664
—
210,088
689,176
Share-based compensation and other transactions
—
—
—
—
15,130
—
—
11,494
26,624
Balances at December 31, 2011
452,215
45
839,703
83
2,714,634
2,793
(1,617,826
)
2,546,309
3,646,038
Net loss from continuing operations
—
—
—
—
—
—
(561,562
)
(1,182,183
)
(1,743,745
)
Net loss from discontinued operations
—
—
—
—
—
—
(167,005
)
(1,356
)
(168,361
)
Foreign currency translation adjustment
—
—
—
—
—
(3,354
)
—
(6,084
)
(9,438
)
Unrealized gain on investments
—
—
—
—
—
28
—
28
56
Issuance of common stock, net of issuance costs,
and other capital transactions
239,100
24
(65,970
)
(6
)
415,467
527
—
(287,806
)
128,206
Share-based compensation and other transactions
—
—
—
—
28,143
—
—
723
28,866
Balances at December 31, 2012
691,315
69
773,733
77
3,158,244
(6
)
(2,346,393
)
1,069,631
1,881,622
Net loss from continuing operations
—
—
—
—
—
—
(579,800
)
(522,505
)
(1,102,305
)
Foreign currency translation adjustment
—
—
—
—
—
16
—
27
43
Unrealized loss on investments
—
—
—
—
—
(12
)
—
(23
)
(35
)
Issuance of common stock, net of issuance costs,
and other capital transactions
131,882
13
(123,145
)
(12
)
295,834
—
—
56,284
352,119
Share-based compensation and other transactions
—
—
—
—
23,104
—
—
(2,132
)
20,972
Balances at July 9, 2013
823,197
$
82
650,588
$
65
$
3,477,182
$
(2
)
$
(2,926,193
)
$
601,282
$
1,152,416