Sprint - Nextel 2013 Annual Report Download - page 39
Download and view the complete annual report
Please find page 39 of the 2013 Sprint - Nextel annual report below. You can navigate through the pages in the report by either clicking on the pages listed below, or by using the keyword search tool below to find specific information within the annual report.-
 1
1 -
2
-
3
-
4
-
5
-
6
-
7
-
8
-
9
-
10
-
11
-
12
-
13
-
14
-
15
-
16
-
17
-
18
-
19
-
20
-
21
-
22
-
23
-
24
-
25
-
26
-
27
-
28
-
 29
29 -
 30
30 -
 31
31 -
 32
32 -
 33
33 -
 34
34 -
 35
35 -
 36
36 -
 37
37 -
 38
38 -
 39
39 -
 40
40 -
 41
41 -
 42
42 -
 43
43 -
 44
44 -
 45
45 -
 46
46 -
 47
47 -
 48
48 -
 49
49 -
50
-
51
-
52
-
53
-
54
-
55
-
56
-
57
-
58
-
59
-
60
-
61
-
62
-
63
-
64
-
65
-
66
-
67
-
68
-
69
-
70
-
71
-
72
-
73
-
74
-
75
-
76
-
77
-
78
-
79
-
80
-
81
-
82
-
83
-
84
-
85
-
86
-
87
-
88
-
89
-
90
-
91
-
92
-
93
-
94
-
95
-
96
-
97
-
98
-
99
-
100
-
101
-
102
-
103
-
104
-
105
-
106
-
107
-
108
-
109
-
110
-
111
-
112
-
113
-
114
-
115
-
116
-
117
-
118
-
119
-
120
-
121
-
122
-
123
-
124
-
125
-
126
-
127
-
128
-
129
-
130
-
131
-
132
-
133
-
134
-
135
-
136
-
137
-
138
-
139
-
140
-
141
-
142
-
143
-
144
-
145
-
146
-
147
-
148
-
149
-
150
-
151
-
152
-
153
-
154
-
155
-
156
-
157
-
158
-
159
-
160
-
161
-
162
-
163
-
164
-
165
-
166
-
167
-
168
-
169
-
170
-
171
-
172
-
173
-
174
-
175
-
176
-
177
-
178
-
179
-
180
-
181
-
182
-
183
-
184
-
185
-
186
-
187
-
188
-
189
-
190
-
191
-
192
-
193
-
194
-
195
-
196
-
197
-
198
-
199
-
200
-
201
-
202
-
203
-
204
-
205
-
206
-
207
-
208
-
209
-
210
-
211
-
212
-
213
-
214
-
215
-
216
-
217
-
218
-
219
-
220
-
221
-
222
-
223
-
224
-
225
-
226
-
227
-
228
-
229
-
230
-
231
-
232
-
233
-
234
-
235
-
236
-
237
-
238
-
239
-
240
-
241
-
242
-
243
-
244
-
245
-
246
-
247
-
248
-
249
-
250
-
251
-
252
-
253
-
254
-
255
-
256
-
257
-
258
-
259
-
260
-
261
-
262
-
263
-
264
-
265
-
266
-
267
-
268
-
269
-
270
-
271
-
272
-
273
-
274
-
275
-
276
-
277
-
278
-
279
-
280
-
281
-
282
-
283
-
284
-
285
 |
 |

Table of Contents
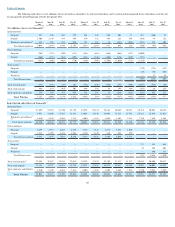
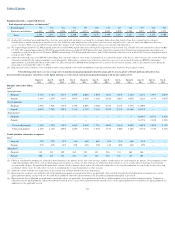
The following table provides an overview of the results of operations of our Wireless segment for the combined consolidated results of operations
for the year ended
December 31, 2013
, the Successor year ended
December 31, 2013
, the Predecessor 191
-
day period ended July 10, 2013, and the Predecessor
years ended
December 31, 2012
and
2011.
___________________
Service Revenue
Our Wireless segment generates service revenue from the sale of wireless services and the sale of wholesale and other services. Service revenue
consists of fixed monthly recurring charges, variable usage charges and miscellaneous fees such as activation fees, directory assistance, roaming, equipment
protection, late payment and early termination charges, and certain regulatory related fees, net of service credits.
The ability of our Wireless segment to generate service revenue is primarily a function of:
Retail comprises those subscribers to whom Sprint directly provides wireless services, whether those services are provided on a postpaid or a
prepaid basis. Wholesale and affiliates are those subscribers who are served through MVNO and affiliate relationships and other arrangements through which
wireless services are sold by Sprint to other companies that resell those services to subscribers.
Successor Year Ended December 31, 2013 and Predecessor Years Ended December 31, 2012 and 2011
Retail service revenue decreased
$15.0 billion
, or
53%
, for the year ended
December 31, 2013
, as compared to the Predecessor year ended
December 31, 2012
, primarily due to comparing operating results for the shortened Post
-
merger period to the
2012
Predecessor period consisting of a full
calendar year. In addition, there was a decline of
1.6%
in average retail subscribers in the
2013
Successor period as compared to the
2012
Predecessor period
primarily resulting from the shut
-
down of the Nextel platform on June 30, 2013. This decrease was partially offset by a higher average revenue per retail
subscriber in
2013
as compared to
2012
primarily due to
37
Combined
Successor
Predecessor
Year Ended
December 31,
Year Ended
December 31,
191 Days Ended
July 10,
Years Ended
December 31,
Wireless Segment Earnings
2013
2013
2013
2012
2011
(in millions)
Sprint platform
$
23,225
$
10,983
$
12,242
$
22,264
$
20,052
Nextel platform
217
—
217
1,455
2,582
Total postpaid
23,442
10,983
12,459
23,719
22,634
Sprint platform
4,867
2,265
2,602
4,380
3,325
Nextel platform
50
—
50
525
1,170
Total prepaid
4,917
2,265
2,652
4,905
4,495
Other(1)
359
331
28
—
—
Retail service revenue
28,718
13,579
15,139
28,624
27,129
Wholesale, affiliate and other
545
266
279
483
261
Total service revenue
29,263
13,845
15,418
29,107
27,390
Cost of services (exclusive of depreciation and amortization)
(9,045
)
(4,342
)
(4,703
)
(9,017
)
(8,907
)
Service gross margin
20,218
9,503
10,715
20,090
18,483
Service gross margin percentage
69
%
69
%
69
%
69
%
67
%
Equipment revenue
3,504
1,797
1,707
3,248
2,911
Cost of products
(9,475
)
(4,603
)
(4,872
)
(9,905
)
(8,057
)
Equipment net subsidy
(5,971
)
(2,806
)
(3,165
)
(6,657
)
(5,146
)
Equipment net subsidy percentage
(170
)%
(156
)%
(185
)%
(205
)%
(177
)%
Selling, general and administrative expense
(9,299
)
(4,519
)
(4,780
)
(9,286
)
(9,070
)
Wireless segment earnings
$
4,948
$
2,178
$
2,770
$
4,147
$
4,267
(1)
Represents service revenue related to the acquisition of certain assets of U.S. Cellular in the 2nd quarter 2013 and the acquisition of Clearwire in the 3rd quarter 2013.
•
revenue generated from each subscriber, which in turn is a function of the types and amount of services utilized by each subscriber and the
rates charged for those services; and
•
the number of subscribers that we serve, which in turn is a function of our ability to retain existing subscribers and acquire new subscribers.