Sprint - Nextel 2013 Annual Report Download - page 84
Download and view the complete annual report
Please find page 84 of the 2013 Sprint - Nextel annual report below. You can navigate through the pages in the report by either clicking on the pages listed below, or by using the keyword search tool below to find specific information within the annual report.-
 1
1 -
2
-
3
-
4
-
5
-
6
-
7
-
8
-
9
-
10
-
11
-
12
-
13
-
14
-
15
-
16
-
17
-
18
-
19
-
20
-
21
-
22
-
23
-
24
-
25
-
26
-
27
-
28
-
29
-
30
-
31
-
32
-
33
-
34
-
35
-
36
-
37
-
38
-
39
-
40
-
41
-
42
-
43
-
44
-
45
-
46
-
47
-
48
-
49
-
50
-
51
-
52
-
53
-
54
-
55
-
56
-
57
-
58
-
59
-
60
-
61
-
62
-
63
-
64
-
65
-
66
-
67
-
68
-
69
-
70
-
71
-
72
-
73
-
 74
74 -
 75
75 -
 76
76 -
 77
77 -
 78
78 -
 79
79 -
 80
80 -
 81
81 -
 82
82 -
 83
83 -
 84
84 -
 85
85 -
 86
86 -
 87
87 -
 88
88 -
 89
89 -
 90
90 -
 91
91 -
 92
92 -
 93
93 -
 94
94 -
95
-
96
-
97
-
98
-
99
-
100
-
101
-
102
-
103
-
104
-
105
-
106
-
107
-
108
-
109
-
110
-
111
-
112
-
113
-
114
-
115
-
116
-
117
-
118
-
119
-
120
-
121
-
122
-
123
-
124
-
125
-
126
-
127
-
128
-
129
-
130
-
131
-
132
-
133
-
134
-
135
-
136
-
137
-
138
-
139
-
140
-
141
-
142
-
143
-
144
-
145
-
146
-
147
-
148
-
149
-
150
-
151
-
152
-
153
-
154
-
155
-
156
-
157
-
158
-
159
-
160
-
161
-
162
-
163
-
164
-
165
-
166
-
167
-
168
-
169
-
170
-
171
-
172
-
173
-
174
-
175
-
176
-
177
-
178
-
179
-
180
-
181
-
182
-
183
-
184
-
185
-
186
-
187
-
188
-
189
-
190
-
191
-
192
-
193
-
194
-
195
-
196
-
197
-
198
-
199
-
200
-
201
-
202
-
203
-
204
-
205
-
206
-
207
-
208
-
209
-
210
-
211
-
212
-
213
-
214
-
215
-
216
-
217
-
218
-
219
-
220
-
221
-
222
-
223
-
224
-
225
-
226
-
227
-
228
-
229
-
230
-
231
-
232
-
233
-
234
-
235
-
236
-
237
-
238
-
239
-
240
-
241
-
242
-
243
-
244
-
245
-
246
-
247
-
248
-
249
-
250
-
251
-
252
-
253
-
254
-
255
-
256
-
257
-
258
-
259
-
260
-
261
-
262
-
263
-
264
-
265
-
266
-
267
-
268
-
269
-
270
-
271
-
272
-
273
-
274
-
275
-
276
-
277
-
278
-
279
-
280
-
281
-
282
-
283
-
284
-
285
 |
 |

Table of Contents
_________________________________
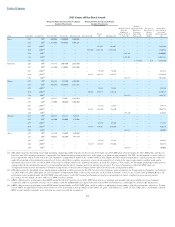
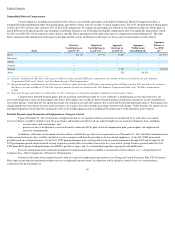
For the 2013 RSU awards, the value represents the aggregate grant date fair market value computed in accordance with FASB ASC Topic 718 as of the date the
Compensation Committee approved the applicable objectives and targets for the two- year performance period under the 2013 LTIC plan. The performance-based RSUs
granted under the 2013 LTIC plan are based on target opportunity and vest on February 27, 2016 but are also subject to performance-based vesting conditions. Payout
values for performance-based RSUs under the 2013 LTIC plan based on maximum performance would be $15,880,768 for Mr. Hesse, $4,631,892 for Mr. Euteneuer,
$4,301,034 for Mr. Elfman, $2,117,428 for Mr. Johnson, and $1,852,758 for each of Messrs. Wunsch and Alves. The time-based RSUs granted under the 2013 LTIC plan
vest on February 27, 2016. The RSUs under the 2011 LTIC plan are allocated one-third to each annual performance period from 2011-2013 and represent the aggregate
grant date fair market value computed in accordance with FASB ASC Topic 718 as of the date the Compensation Committee approved the applicable objectives and targets
for the 2013 performance period. Each annual performance target was set by the Compensation Committee at the start of each respective single year performance period
under the 2011 LTIC plan. For more information regarding Mr. Hesse's retention award, see "—Compensation Discussion and Analysis—
Setting Executive
Compensation—Other Compensation Decisions for 2013." For more information regarding the 2013 LTIC plan, see "—Compensation Discussion and Analysis—Primary
Components of Executive Compensation—Long-Term Incentive Compensation Plan."
With respect to the 2013 STIC plan, each named executive officer earned a payout of 118.96% of his targeted opportunity based on actual performance in 2013. For more
information regarding our STIC plan, see "—Compensation Discussion and Analysis—Primary Components of Executive Compensation—Short-Term Incentive
Compensation Plan."
With respect to the performance units under the 2011 LTIC plan, the amount shown is the amount allocable to the 2013 performance period with respect to performance units
granted by the Compensation Committee on February 23, 2011. The performance unit award under the 2011 LTIC plan is allocated one-third to each annual performance
period for three years (2011-
2013) and is payable in cash after the end of the three
-year period. Each annual performance target is set by the Compensation Committee at the
start of each respective single-year performance period, and the payout of the performance unit award may range from 0% to 150% based on the achievement of specified
results. As a result of the SoftBank Merger, the performance units granted under the 2011 LTIC plan with respect to the 2013 annual performance period were deemed met at
target, resulting in an aggregate payout percentage for our named executive officers of 100% for those awards. Performance units granted under the 2012 LTIC plan were
deemed met at target as a result of the SoftBank Merger, resulting in an aggregate payout percentage for our named executive officers of 100% for those awards. See "—
Note 2
—Summary of Significant Accounting Policies" and "—Compensation Discussion and Analysis—
Setting Executive Compensation
—Other Compensation Decisions for
2013."
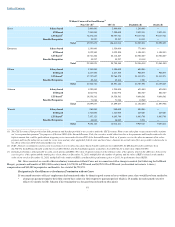
82
(1)
The value shown for 2013 is the sum of three awards: the performance-based RSU awards allocable to the 2013 performance period under the 2011 LTIC plan plus time-
and performance-based RSU awards under the 2013 LTIC plan. The value shown for Mr. Hesse also includes a retention award in the form of time-based RSUs.
2011 pRSUs
($)
2013 RSUs
($)
2013 pRSUs
($)
Retention RSUs
($)
Total
($)
Hesse
1,884,969
6,900,003
7,940,384
11,057,191
27,782,547
Euteneuer
447,821
2,012,501
2,315,946
—
4,776,268
Elfman
428,946
1,868,747
2,150,517
—
4,448,210
Johnson
184,778
919,998
1,058,714
—
2,163,490
Wunsch
171,581
805,002
926,379
—
1,902,962
Alves
148,481
805,002
926,379
—
1,879,862
(2)
Represents the grant date fair value of options granted in 2013 computed in accordance with FASB ASC Topic 718. The grant date fair value for the options awarded is
$3.63 per share. See "—
Note 2
—Summary of Significant Accounting Policies." For more information regarding Mr. Hesse's retention award, see "—Compensation
Discussion and Analysis—
Setting Executive Compensation
—Other Compensation Decisions for 2013."
(3)
The value shown for 2013 is the sum of performance unit awards under the 2011 LTIC plan allocable to the 2013 performance period, performance unit awards earned in
2013 under the 2012 LTIC plan, and the payout under the 2013 STIC plan.
2011 Performance
Units
($)
2012 Performance
Units ($)
2013 STIC Plan
($)
Total
($)
Hesse
1,956,800
8,620,000
2,855,114
13,431,914
Euteneuer
583,334
1,750,000
1,198,553
3,531,887
Elfman
541,667
1,625,000
966,575
3,133,242
Johnson
233,334
750,000
662,327
1,645,661
Wunsch
216,667
700,000
489,867
1,406,534
Alves
187,500
700,000
528,054
1,415,554