Sprint - Nextel 2013 Annual Report Download - page 134
Download and view the complete annual report
Please find page 134 of the 2013 Sprint - Nextel annual report below. You can navigate through the pages in the report by either clicking on the pages listed below, or by using the keyword search tool below to find specific information within the annual report.-
 1
1 -
2
-
3
-
4
-
5
-
6
-
7
-
8
-
9
-
10
-
11
-
12
-
13
-
14
-
15
-
16
-
17
-
18
-
19
-
20
-
21
-
22
-
23
-
24
-
25
-
26
-
27
-
28
-
29
-
30
-
31
-
32
-
33
-
34
-
35
-
36
-
37
-
38
-
39
-
40
-
41
-
42
-
43
-
44
-
45
-
46
-
47
-
48
-
49
-
50
-
51
-
52
-
53
-
54
-
55
-
56
-
57
-
58
-
59
-
60
-
61
-
62
-
63
-
64
-
65
-
66
-
67
-
68
-
69
-
70
-
71
-
72
-
73
-
74
-
75
-
76
-
77
-
78
-
79
-
80
-
81
-
82
-
83
-
84
-
85
-
86
-
87
-
88
-
89
-
90
-
91
-
92
-
93
-
94
-
95
-
96
-
97
-
98
-
99
-
100
-
101
-
102
-
103
-
104
-
105
-
106
-
107
-
108
-
109
-
110
-
111
-
112
-
113
-
114
-
115
-
116
-
117
-
118
-
119
-
120
-
121
-
122
-
123
-
 124
124 -
 125
125 -
 126
126 -
 127
127 -
 128
128 -
 129
129 -
 130
130 -
 131
131 -
 132
132 -
 133
133 -
 134
134 -
 135
135 -
 136
136 -
 137
137 -
 138
138 -
 139
139 -
 140
140 -
 141
141 -
 142
142 -
 143
143 -
 144
144 -
145
-
146
-
147
-
148
-
149
-
150
-
151
-
152
-
153
-
154
-
155
-
156
-
157
-
158
-
159
-
160
-
161
-
162
-
163
-
164
-
165
-
166
-
167
-
168
-
169
-
170
-
171
-
172
-
173
-
174
-
175
-
176
-
177
-
178
-
179
-
180
-
181
-
182
-
183
-
184
-
185
-
186
-
187
-
188
-
189
-
190
-
191
-
192
-
193
-
194
-
195
-
196
-
197
-
198
-
199
-
200
-
201
-
202
-
203
-
204
-
205
-
206
-
207
-
208
-
209
-
210
-
211
-
212
-
213
-
214
-
215
-
216
-
217
-
218
-
219
-
220
-
221
-
222
-
223
-
224
-
225
-
226
-
227
-
228
-
229
-
230
-
231
-
232
-
233
-
234
-
235
-
236
-
237
-
238
-
239
-
240
-
241
-
242
-
243
-
244
-
245
-
246
-
247
-
248
-
249
-
250
-
251
-
252
-
253
-
254
-
255
-
256
-
257
-
258
-
259
-
260
-
261
-
262
-
263
-
264
-
265
-
266
-
267
-
268
-
269
-
270
-
271
-
272
-
273
-
274
-
275
-
276
-
277
-
278
-
279
-
280
-
281
-
282
-
283
-
284
-
285
 |
 |

Table of Contents
Index to Consolidated Financial Statements
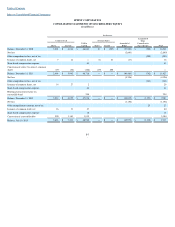
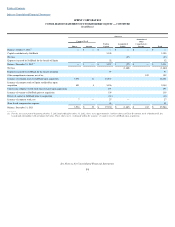
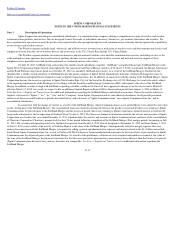
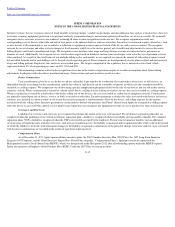
SPRINT CORPORATION
NOTES TO THE CONSOLIDATED FINANCIAL STATEMENTS
and non
-
share based awards, including stock options, stock appreciation rights, restricted stock, restricted stock units, performance shares, performance units
and other equity
-
based and cash awards to employees, outside directors and other eligible individuals as defined by the plan. As of
December 31, 2013
, the
number of shares available and reserved for future grants under the 2007 Plan and ESPP totaled approximately
195 million
common shares. The Compensation
Committee of our board of directors, or one or more executive officers should the Compensation Committee so authorize, as provided in the 2007 Plan, will
determine the terms of each share and non
-
share based award. No new grants can be made under the 1997 Program or the Nextel Plan. We use new shares to
satisfy share
-
based awards or treasury shares, if available.
The fair value of each option award is estimated on the grant date using the Black
-
Scholes option valuation model, based on several assumptions
including the risk
-
free interest rate, volatility, expected dividend yield and expected term. During the Successor year ended
2013
, the Company granted
1.7
million
stock options with weighted average grant date fair value of
$3.63
per share based upon assumptions of a risk free interest rate of
2.01%
, weighted
average expected volatility of
42.3%
, expected dividend yield of 0% and expected term of
7.5
years. In general, options are granted with an exercise price equal to
the market value of the underlying shares on the grant date, vest on an annual basis over three or four years, and have a contractual term of ten years. As of
December 31, 2013
,
48 million
options were outstanding of which
34 million
options were exercisable.
The fair value of each restricted stock unit award is calculated using the share price at the date of grant. Restricted stock units generally have
performance and service requirements or service requirements only with vesting periods ranging from one to three years. Employees and directors who are
granted restricted stock units are not required to pay for the shares but generally must remain employed with us, or continue to serve as a member of our board
of directors, until the restrictions lapse, which is typically three years for employees and one year for directors. Certain restricted stock units outstanding as of
December 31, 2013
, are entitled to dividend equivalents paid in cash, if dividends are declared and paid on common shares, but performance
-
based restricted
stock units are not entitled to dividend equivalent payments until the applicable performance and service criteria have been met. During the Successor year
ended
2013
, the Company granted
18 million
service only and performance
-
based restricted stock units with a weighted average grant date fair value of
$6.23
per
share. During the Predecessor 191
-
day period ended July 10, 2013, approximately
2 million
service only and performance
-
based restricted stock units were
granted with a weighted average grant date fair value of
$5.96
per share. At
December 31, 2013
, restricted stock unit awards totaling
33 million
were outstanding.
Compensation Costs
The cost of employee services received in exchange for share
-
based awards classified as equity is measured using the estimated fair value of the
award on the date of the grant, and that cost is recognized over the period that the award recipient is required to provide service in exchange for the award.
Awards of instruments classified as liabilities are measured at the estimated fair value at each reporting date through settlement. Share
-
based compensation cost
related to awards with graded vesting is recognized using the straight
-
line method.
Pre
-
tax share and non
-
share based compensation charges from our incentive plans included in net loss were
$98 million
for the Successor period
ended
December 31, 2013
,
$37 million
for the Predecessor 191
-
day period ended July 10, 2013, and
$82 million
and
$73 million
for the Predecessor years ended
2012
and
2011
, respectively. The net income tax benefit recognized in the consolidated financial statements for share
-
based compensation awards was
$34
million
for the Successor period ended
December 31, 2013
,
$2 million
for the Predecessor 191
-
day period ended July 10, 2013, and
$14 million
and
$13 million
for
the Predecessor years ended
2012
and
2011
. As of
December 31, 2013
, there was
$126 million
of total unrecognized compensation cost related to non
-
vested
incentive awards that are expected to be recognized over a weighted average period of
2.14
years.
Advertising Costs
We recognize advertising expense when incurred as selling, general and administrative expense. Advertising expenses totaled
$697 million
for the
Successor period ended
December 31, 2013
and
$858 million
for the Predecessor 191
-
day period ended July 10, 2013 and
$1.4 billion
for each of the Predecessor
years ended
December 31, 2012
and
2011.
F
-
16