Sprint - Nextel 2013 Annual Report Download - page 49
Download and view the complete annual report
Please find page 49 of the 2013 Sprint - Nextel annual report below. You can navigate through the pages in the report by either clicking on the pages listed below, or by using the keyword search tool below to find specific information within the annual report.-
 1
1 -
2
-
3
-
4
-
5
-
6
-
7
-
8
-
9
-
10
-
11
-
12
-
13
-
14
-
15
-
16
-
17
-
18
-
19
-
20
-
21
-
22
-
23
-
24
-
25
-
26
-
27
-
28
-
29
-
30
-
31
-
32
-
33
-
34
-
35
-
36
-
37
-
38
-
 39
39 -
 40
40 -
 41
41 -
 42
42 -
 43
43 -
 44
44 -
 45
45 -
 46
46 -
 47
47 -
 48
48 -
 49
49 -
 50
50 -
 51
51 -
 52
52 -
 53
53 -
 54
54 -
 55
55 -
 56
56 -
 57
57 -
 58
58 -
 59
59 -
60
-
61
-
62
-
63
-
64
-
65
-
66
-
67
-
68
-
69
-
70
-
71
-
72
-
73
-
74
-
75
-
76
-
77
-
78
-
79
-
80
-
81
-
82
-
83
-
84
-
85
-
86
-
87
-
88
-
89
-
90
-
91
-
92
-
93
-
94
-
95
-
96
-
97
-
98
-
99
-
100
-
101
-
102
-
103
-
104
-
105
-
106
-
107
-
108
-
109
-
110
-
111
-
112
-
113
-
114
-
115
-
116
-
117
-
118
-
119
-
120
-
121
-
122
-
123
-
124
-
125
-
126
-
127
-
128
-
129
-
130
-
131
-
132
-
133
-
134
-
135
-
136
-
137
-
138
-
139
-
140
-
141
-
142
-
143
-
144
-
145
-
146
-
147
-
148
-
149
-
150
-
151
-
152
-
153
-
154
-
155
-
156
-
157
-
158
-
159
-
160
-
161
-
162
-
163
-
164
-
165
-
166
-
167
-
168
-
169
-
170
-
171
-
172
-
173
-
174
-
175
-
176
-
177
-
178
-
179
-
180
-
181
-
182
-
183
-
184
-
185
-
186
-
187
-
188
-
189
-
190
-
191
-
192
-
193
-
194
-
195
-
196
-
197
-
198
-
199
-
200
-
201
-
202
-
203
-
204
-
205
-
206
-
207
-
208
-
209
-
210
-
211
-
212
-
213
-
214
-
215
-
216
-
217
-
218
-
219
-
220
-
221
-
222
-
223
-
224
-
225
-
226
-
227
-
228
-
229
-
230
-
231
-
232
-
233
-
234
-
235
-
236
-
237
-
238
-
239
-
240
-
241
-
242
-
243
-
244
-
245
-
246
-
247
-
248
-
249
-
250
-
251
-
252
-
253
-
254
-
255
-
256
-
257
-
258
-
259
-
260
-
261
-
262
-
263
-
264
-
265
-
266
-
267
-
268
-
269
-
270
-
271
-
272
-
273
-
274
-
275
-
276
-
277
-
278
-
279
-
280
-
281
-
282
-
283
-
284
-
285
 |
 |

Table of Contents
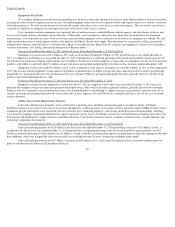
paid to other carriers. The remaining costs associated with operating the Wireline segment include the costs to operate our customer care and billing
organizations in addition to administrative support. Wireline service revenue and variable network and interconnection costs fluctuate with the changes in our
customer base and their related usage, but some cost elements do not fluctuate in the short term with the changes in our customer usage. Our wireline services
provided to our Wireless segment are generally accounted for based on market rates, which we believe approximate fair value. The Company generally re
-
establishes these rates at the beginning of each fiscal year. Over the past several years, there has been an industry wide trend of lower rates due to increased
competition from other wireline and wireless communications companies as well as cable and Internet service providers. Declines in wireline segment earnings
related to intercompany pricing rates do not affect our consolidated results of operations as our Wireless segment benefits from an equivalent reduction in cost
of service.
The following table provides an overview of the results of operations of our Wireline segment for the combined consolidated results of operations
for the year ended
December 31, 2013
, the Successor year ended
December 31, 2013
, the Predecessor 191
-
day period ended July 10, 2013, and the Predecessor
years ended
December 31, 2012
and
2011.
Wireline Revenue
Successor Year Ended December 31, 2013 and Predecessor Years Ended December 31, 2012 and 2011
Voice Revenues
Voice revenues decreased
$908 million
, or
56%
, for the Successor year ended
December 31, 2013
as compared to the Predecessor year ended
December 31, 2012
primarily due to comparing operating results for the shortened Post
-
merger period to a period consisting of a full calendar year. Voice
revenues decreased
$288 million
, or
15%
, in
2012
as compared to
2011
primarily driven by overall price declines of which $174 million was related to the decline in
prices for the sale of services to our Wireless segment as well as volume declines due to customer churn. Voice revenues generated from the sale of services to
our Wireless segment represented
33%
of total voice revenues for the year ended
December 31, 2013
as compared to
32%
and
34%
for the years ended
2012
and
2011
, respectively.
Data Revenues
Data revenues reflect sales of data services, primarily Private Line, and managed network services bundled with non
-
IP
-
based data access. Data
revenues decreased
$260 million
, or
65%
, for the Successor year ended
December 31, 2013
as compared to the Predecessor year ended
December 31, 2012
primarily due to comparing operating results for the shortened Post
-
merger period to a period consisting of a full calendar year. Data revenues decreased
$62
million
, or
13%
, in
2012
as compared to
2011
as a result of customer churn driven by the focus to no longer provide frame relay and asynchronous transfer mode
(ATM) services, which was phased out early in 2013. Data revenues generated from the provision of services to the Wireless segment represented
50%
of total
data revenue for the year ended
December 31, 2013
as compared to
44%
and
35%
for the years ended
2012
and
2011
, respectively.
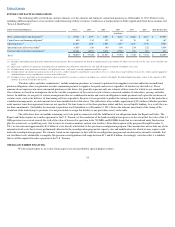
47
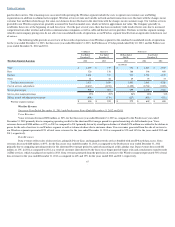
Combined
Successor
Predecessor
Year Ended
December 31,
Year Ended
December 31,
191 Days Ended
July 10,
Years Ended
December 31,
Wireline Segment Earnings
2013
2013
2013
2012
2011
(in millions)
Voice
$
1,490
$
719
$
771
$
1,627
$
1,915
Data
326
138
188
398
460
Internet
1,660
747
913
1,781
1,878
Other
61
32
29
75
73
Total net service revenue
3,537
1,636
1,901
3,881
4,326
Cost of services and products
(2,637
)
(1,235
)
(1,402
)
(2,781
)
(3,005
)
Service gross margin
900
401
499
1,100
1,321
Service gross margin percentage
25
%
25
%
26
%
28
%
31
%
Selling, general and administrative expense
(406
)
(179
)
(227
)
(451
)
(521
)
Wireline segment earnings
$
494
$
222
$
272
$
649
$
800