Sprint - Nextel 2013 Annual Report Download - page 40
Download and view the complete annual report
Please find page 40 of the 2013 Sprint - Nextel annual report below. You can navigate through the pages in the report by either clicking on the pages listed below, or by using the keyword search tool below to find specific information within the annual report.-
 1
1 -
2
-
3
-
4
-
5
-
6
-
7
-
8
-
9
-
10
-
11
-
12
-
13
-
14
-
15
-
16
-
17
-
18
-
19
-
20
-
21
-
22
-
23
-
24
-
25
-
26
-
27
-
28
-
29
-
 30
30 -
 31
31 -
 32
32 -
 33
33 -
 34
34 -
 35
35 -
 36
36 -
 37
37 -
 38
38 -
 39
39 -
 40
40 -
 41
41 -
 42
42 -
 43
43 -
 44
44 -
 45
45 -
 46
46 -
 47
47 -
 48
48 -
 49
49 -
 50
50 -
51
-
52
-
53
-
54
-
55
-
56
-
57
-
58
-
59
-
60
-
61
-
62
-
63
-
64
-
65
-
66
-
67
-
68
-
69
-
70
-
71
-
72
-
73
-
74
-
75
-
76
-
77
-
78
-
79
-
80
-
81
-
82
-
83
-
84
-
85
-
86
-
87
-
88
-
89
-
90
-
91
-
92
-
93
-
94
-
95
-
96
-
97
-
98
-
99
-
100
-
101
-
102
-
103
-
104
-
105
-
106
-
107
-
108
-
109
-
110
-
111
-
112
-
113
-
114
-
115
-
116
-
117
-
118
-
119
-
120
-
121
-
122
-
123
-
124
-
125
-
126
-
127
-
128
-
129
-
130
-
131
-
132
-
133
-
134
-
135
-
136
-
137
-
138
-
139
-
140
-
141
-
142
-
143
-
144
-
145
-
146
-
147
-
148
-
149
-
150
-
151
-
152
-
153
-
154
-
155
-
156
-
157
-
158
-
159
-
160
-
161
-
162
-
163
-
164
-
165
-
166
-
167
-
168
-
169
-
170
-
171
-
172
-
173
-
174
-
175
-
176
-
177
-
178
-
179
-
180
-
181
-
182
-
183
-
184
-
185
-
186
-
187
-
188
-
189
-
190
-
191
-
192
-
193
-
194
-
195
-
196
-
197
-
198
-
199
-
200
-
201
-
202
-
203
-
204
-
205
-
206
-
207
-
208
-
209
-
210
-
211
-
212
-
213
-
214
-
215
-
216
-
217
-
218
-
219
-
220
-
221
-
222
-
223
-
224
-
225
-
226
-
227
-
228
-
229
-
230
-
231
-
232
-
233
-
234
-
235
-
236
-
237
-
238
-
239
-
240
-
241
-
242
-
243
-
244
-
245
-
246
-
247
-
248
-
249
-
250
-
251
-
252
-
253
-
254
-
255
-
256
-
257
-
258
-
259
-
260
-
261
-
262
-
263
-
264
-
265
-
266
-
267
-
268
-
269
-
270
-
271
-
272
-
273
-
274
-
275
-
276
-
277
-
278
-
279
-
280
-
281
-
282
-
283
-
284
-
285
 |
 |

Table of Contents
the $10 premium data add
-
on charge for smartphones, combined with increased postpaid and prepaid revenues resulting from acquisitions in 2013.
Retail service revenue increased
$1.5 billion
, or 6%
, in
2012
as compared to 2011, which primarily reflects an increase in Sprint platform postpaid
service revenue related to the $10 premium data add
-
on charge required for smartphones and continued popularity of unlimited and bundled plans, combined
with increases in roaming and other fees. The increase was also driven by continued subscriber growth from our Assurance Wireless brand as well as a growing
number of subscribers on our remaining prepaid brands who are choosing higher rate plans as a result of the increased availability of smartphones.
Wholesale, affiliate and other revenues decreased
$217 million
, or
45%
, for the year ended
December 31, 2013
as compared to the Predecessor year
ended
December 31, 2012
, primarily due to comparing operating results for the shortened Post
-
merger period to the
2012
Predecessor period consisting of a full
calendar year. The decrease was partially offset by an increase in revenues resulting from acquisitions in 2013, combined with growth in our MVNO's reselling
postpaid services and connected devices. Approximately
43%
of our wholesale and affiliate subscribers represent connected devices. These devices generate
revenue from usage which varies depending on the solution being utilized. Average revenue per connected device is generally significantly lower than revenue
from other wholesale and affiliate subscribers; however, the cost to service these subscribers is also lower resulting in a higher gross margin as a percent of
revenue.
Wholesale, affiliate and other revenues increased
$222 million
, or
85%
, for
2012
as compared to 2011 primarily as a result of growth in our MVNO's
reselling prepaid services. Specifically, growth in subscribers on the Lifeline program offered through our MVNO's reselling prepaid services, which is similar to
our Assurance Wireless offering, contributed to revenue growth. Approximately
33%
of our wholesale and affiliate subscribers in 2012 represented a growing
number of connected devices.
Combined Year Ended December 31, 2013 and Predecessor Year Ended December 31, 2012
In addition to the explanations above, retail service revenue for the combined year ended
December 31, 2013
as compared to the Predecessor year
ended
December 31, 2012
increased $94 million primarily from the consolidation of Clearwire and subscriber growth mainly in our Virgin prepaid brand as prepaid
subscribers are choosing higher rate plans as a result of the increased availability of smartphones. In addition, Sprint platform postpaid service revenue
increased due to our $10 premium data add
-
on charge required for all smartphones combined with a reduction in the number of subscribers eligible for certain
plan discounts due to policy changes and fewer customer care credits.
In addition to the explanations above, wholesale, affiliate and other revenue for the combined year ended
December 31, 2013
as compared to the same
Predecessor year ended
December 31, 2012
increased due to slight growth in the reselling of prepaid services by MVNO's and affiliates.
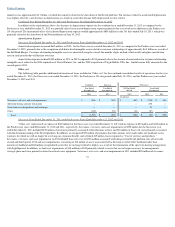
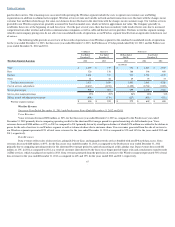
Average Monthly Service Revenue per Subscriber and Subscriber Trends
The table below summarizes average number of retail subscribers for the combined consolidated results of operations for the year ended
December 31, 2013
, the Successor year ended
December 31, 2013
, the Predecessor 191
-
day period ended July 10, 2013, and the Predecessor years ended
December 31, 2012
and
2011
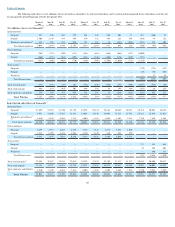
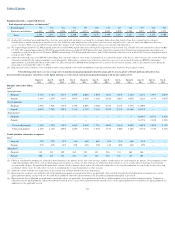
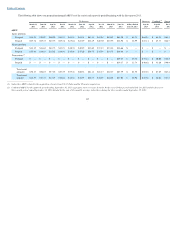
. Additional information about the number of subscribers, net additions (losses) to subscribers, and average rates of monthly
postpaid and prepaid subscriber churn for each quarter since the first quarter
2011
may be found in the tables on the following pages.
38
Combined
Successor
Predecessor
Year Ended
December 31,
Year Ended
December 31,
191 Days Ended
July 10,
Years Ended
December 31,
2013
2013
2013
2012
2011
(subscribers in thousands)
Average postpaid subscribers
31,124
30,957
31,296
32,462
32,935
Average prepaid subscribers
15,901
16,040
15,793
15,291
13,672
Average retail subscribers
47,025
46,997
47,089
47,753
46,607