Sprint - Nextel 2013 Annual Report Download - page 173
Download and view the complete annual report
Please find page 173 of the 2013 Sprint - Nextel annual report below. You can navigate through the pages in the report by either clicking on the pages listed below, or by using the keyword search tool below to find specific information within the annual report.-
 1
1 -
2
-
3
-
4
-
5
-
6
-
7
-
8
-
9
-
10
-
11
-
12
-
13
-
14
-
15
-
16
-
17
-
18
-
19
-
20
-
21
-
22
-
23
-
24
-
25
-
26
-
27
-
28
-
29
-
30
-
31
-
32
-
33
-
34
-
35
-
36
-
37
-
38
-
39
-
40
-
41
-
42
-
43
-
44
-
45
-
46
-
47
-
48
-
49
-
50
-
51
-
52
-
53
-
54
-
55
-
56
-
57
-
58
-
59
-
60
-
61
-
62
-
63
-
64
-
65
-
66
-
67
-
68
-
69
-
70
-
71
-
72
-
73
-
74
-
75
-
76
-
77
-
78
-
79
-
80
-
81
-
82
-
83
-
84
-
85
-
86
-
87
-
88
-
89
-
90
-
91
-
92
-
93
-
94
-
95
-
96
-
97
-
98
-
99
-
100
-
101
-
102
-
103
-
104
-
105
-
106
-
107
-
108
-
109
-
110
-
111
-
112
-
113
-
114
-
115
-
116
-
117
-
118
-
119
-
120
-
121
-
122
-
123
-
124
-
125
-
126
-
127
-
128
-
129
-
130
-
131
-
132
-
133
-
134
-
135
-
136
-
137
-
138
-
139
-
140
-
141
-
142
-
143
-
144
-
145
-
146
-
147
-
148
-
149
-
150
-
151
-
152
-
153
-
154
-
155
-
156
-
157
-
158
-
159
-
160
-
161
-
162
-
 163
163 -
 164
164 -
 165
165 -
 166
166 -
 167
167 -
 168
168 -
 169
169 -
 170
170 -
 171
171 -
 172
172 -
 173
173 -
 174
174 -
 175
175 -
 176
176 -
 177
177 -
 178
178 -
 179
179 -
 180
180 -
 181
181 -
 182
182 -
 183
183 -
184
-
185
-
186
-
187
-
188
-
189
-
190
-
191
-
192
-
193
-
194
-
195
-
196
-
197
-
198
-
199
-
200
-
201
-
202
-
203
-
204
-
205
-
206
-
207
-
208
-
209
-
210
-
211
-
212
-
213
-
214
-
215
-
216
-
217
-
218
-
219
-
220
-
221
-
222
-
223
-
224
-
225
-
226
-
227
-
228
-
229
-
230
-
231
-
232
-
233
-
234
-
235
-
236
-
237
-
238
-
239
-
240
-
241
-
242
-
243
-
244
-
245
-
246
-
247
-
248
-
249
-
250
-
251
-
252
-
253
-
254
-
255
-
256
-
257
-
258
-
259
-
260
-
261
-
262
-
263
-
264
-
265
-
266
-
267
-
268
-
269
-
270
-
271
-
272
-
273
-
274
-
275
-
276
-
277
-
278
-
279
-
280
-
281
-
282
-
283
-
284
-
285
 |
 |

Table of Contents
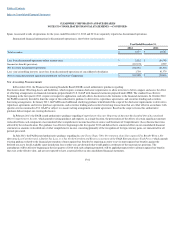
Index to Consolidated Financial Statements
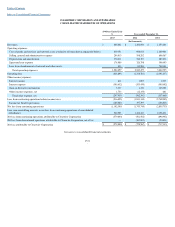
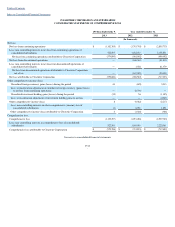
CLEARWIRE CORPORATION AND SUBSIDIARIES
CONSOLIDATED STATEMENTS OF CASH FLOWS
190 Days Ended July 9,
Year ended December 31,
2013
2012
2011
(In thousands)
Cash flows from operating activities:
Net loss from continuing operations
$
(1,102,305
)
$
(1,743,745
)
$
(2,855,733
)
Adjustments to reconcile net loss to net cash used in operating activities:
Deferred income taxes
184,599
(199,199
)
105,308
Non-cash gain on derivative instruments
(5,337
)
(1,356
)
(145,308
)
Accretion of discount on debt
36,832
41,386
40,216
Depreciation and amortization
370,411
768,193
687,636
Amortization of spectrum leases
27,871
54,328
53,674
Non-cash rent expense
82,332
197,169
342,962
Loss on property, plant and equipment (Note 4)
10,085
171,780
966,441
Other operating activities
20,973
42,740
27,745
Changes in assets and liabilities:
Inventory
(10,057
)
11,200
15,697
Accounts receivable
(2,770
)
50,401
(54,212
)
Prepaids and other assets
(53,431
)
326
22,447
Prepaid spectrum licenses
—
1,904
(4,360
)
Deferred revenue
39,227
170,455
16,497
Accounts payable and other liabilities
60,329
(17,090
)
(152,180
)
Net cash used in operating activities of continuing operations
(341,241
)
(451,508
)
(933,170
)
Net cash provided by (used in) operating activities of discontinued operations
—
(3,000
)
2,381
Net cash used in operating activities
(341,241
)
(454,508
)
(930,789
)
Cash flows from investing activities:
Capital expenditures
(76,843
)
(112,997
)
(405,655
)
Purchases of available-
for
-sale investments
(501,814
)
(1,797,787
)
(957,883
)
Disposition of available-
for
-sale investments
699,450
1,339,078
1,255,176
Other investing activities
1,224
(655
)
20,229
Net cash provided by (used in) investing activities of continuing operations
122,017
(572,361
)
(88,133
)
Net cash provided by (used in) investing activities of discontinued operations
—
1,185
(3,886
)
Net cash provided by (used in) investing activities
122,017
(571,176
)
(92,019
)
Cash flows from financing activities:
Principal payments on long-term debt
(20,566
)
(26,985
)
(29,957
)
Proceeds from issuance of long-term debt
240,000
300,000
—
Debt financing fees
—
(6,205
)
(1,159
)
Equity investment by strategic investors
199
8
331,400
Proceeds from issuance of common stock
—
58,460
387,279
Net cash provided by financing activities of continuing operations
219,633
325,278
687,563
Net cash provided by financing activities of discontinued operations
—
—
—
Net cash provided by financing activities
219,633
325,278
687,563
Effect of foreign currency exchange rates on cash and cash equivalents
58
107
(4,573
)
Net increase (decrease) in cash and cash equivalents
467
(700,299
)
(339,818
)
Cash and cash equivalents:
Beginning of period
193,445
893,744
1,233,562
End of period
193,912
193,445
893,744
Less: cash and cash equivalents of discontinued operations at end of period
—
—
1,815
Cash and cash equivalents of continuing operations at end of period
$
193,912
$
193,445
$
891,929
Supplemental cash flow disclosures:
Cash paid for interest including capitalized interest paid
$
256,227
$
505,913
$
474,849
Non-cash investing activities:
Fixed asset purchases in accounts payable and accrued expenses
$
18,337
$
20,795
$
14,144
Fixed asset purchases financed by long-term debt
$
50,126
$
36,229
$
11,514
Non-cash financing activities: