Sprint - Nextel 2013 Annual Report Download - page 47
Download and view the complete annual report
Please find page 47 of the 2013 Sprint - Nextel annual report below. You can navigate through the pages in the report by either clicking on the pages listed below, or by using the keyword search tool below to find specific information within the annual report.-
 1
1 -
2
-
3
-
4
-
5
-
6
-
7
-
8
-
9
-
10
-
11
-
12
-
13
-
14
-
15
-
16
-
17
-
18
-
19
-
20
-
21
-
22
-
23
-
24
-
25
-
26
-
27
-
28
-
29
-
30
-
31
-
32
-
33
-
34
-
35
-
36
-
 37
37 -
 38
38 -
 39
39 -
 40
40 -
 41
41 -
 42
42 -
 43
43 -
 44
44 -
 45
45 -
 46
46 -
 47
47 -
 48
48 -
 49
49 -
 50
50 -
 51
51 -
 52
52 -
 53
53 -
 54
54 -
 55
55 -
 56
56 -
 57
57 -
58
-
59
-
60
-
61
-
62
-
63
-
64
-
65
-
66
-
67
-
68
-
69
-
70
-
71
-
72
-
73
-
74
-
75
-
76
-
77
-
78
-
79
-
80
-
81
-
82
-
83
-
84
-
85
-
86
-
87
-
88
-
89
-
90
-
91
-
92
-
93
-
94
-
95
-
96
-
97
-
98
-
99
-
100
-
101
-
102
-
103
-
104
-
105
-
106
-
107
-
108
-
109
-
110
-
111
-
112
-
113
-
114
-
115
-
116
-
117
-
118
-
119
-
120
-
121
-
122
-
123
-
124
-
125
-
126
-
127
-
128
-
129
-
130
-
131
-
132
-
133
-
134
-
135
-
136
-
137
-
138
-
139
-
140
-
141
-
142
-
143
-
144
-
145
-
146
-
147
-
148
-
149
-
150
-
151
-
152
-
153
-
154
-
155
-
156
-
157
-
158
-
159
-
160
-
161
-
162
-
163
-
164
-
165
-
166
-
167
-
168
-
169
-
170
-
171
-
172
-
173
-
174
-
175
-
176
-
177
-
178
-
179
-
180
-
181
-
182
-
183
-
184
-
185
-
186
-
187
-
188
-
189
-
190
-
191
-
192
-
193
-
194
-
195
-
196
-
197
-
198
-
199
-
200
-
201
-
202
-
203
-
204
-
205
-
206
-
207
-
208
-
209
-
210
-
211
-
212
-
213
-
214
-
215
-
216
-
217
-
218
-
219
-
220
-
221
-
222
-
223
-
224
-
225
-
226
-
227
-
228
-
229
-
230
-
231
-
232
-
233
-
234
-
235
-
236
-
237
-
238
-
239
-
240
-
241
-
242
-
243
-
244
-
245
-
246
-
247
-
248
-
249
-
250
-
251
-
252
-
253
-
254
-
255
-
256
-
257
-
258
-
259
-
260
-
261
-
262
-
263
-
264
-
265
-
266
-
267
-
268
-
269
-
270
-
271
-
272
-
273
-
274
-
275
-
276
-
277
-
278
-
279
-
280
-
281
-
282
-
283
-
284
-
285
 |
 |

Table of Contents
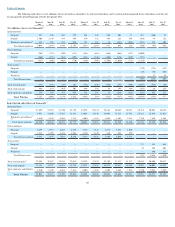
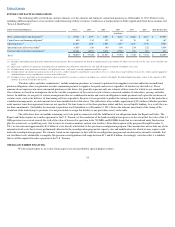
Equipment Net Subsidy
We recognize equipment revenue and corresponding costs of devices when title and risk of loss passes to the indirect dealer or end
-
use subscriber,
assuming all other revenue recognition criteria are met. Our marketing plans assume that devices typically will be sold at prices below cost, which is consistent
with industry practice. We offer certain incentives to retain and acquire subscribers such as new devices at discounted prices. The cost of these incentives is
recorded as a reduction to equipment revenue upon activation of the device with a service contract.
Cost of products includes equipment costs (primarily devices and accessories), order fulfillment related expenses, and write
-
downs of device and
accessory inventory related to shrinkage and obsolescence. Additionally, cost of products is reduced by any rebates that are earned from the equipment
manufacturers. Cost of products in excess of the net revenue generated from equipment sales is referred to in the industry as equipment net subsidy. We also
make incentive payments to certain indirect dealers, who purchase the iPhone® directly from Apple. Those payments are recognized as selling, general and
administrative expenses when the device is activated with a Sprint service plan because Sprint does not recognize any equipment revenue or cost of products
for those transactions. (See Selling, General and Administrative Expense below.)
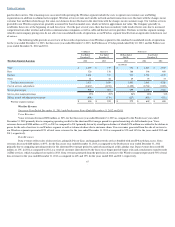
Successor Year Ended December 31, 2013 and Predecessor Years Ended December 31, 2012 and 2011
Equipment revenue decreased
$1.5 billion
, or
45%
, and cost of products declined
$5.3 billion
, or
54%
, for the Successor year ended
December 31,
2013
, as compared to the Predecessor year ended
December 31, 2012
, primarily due to comparing operating results for the shortened Post
-
merger period to the
2012
Predecessor period consisting of a full calendar year. In addition, the decrease in both equipment revenue and cost of products was due to fewer postpaid
handsets sold, which was partially offset by higher average sales prices per postpaid and prepaid device sold as well as increases in prepaid handsets sold.
Equipment revenue increased
$337 million
, or
12%
, in
2012
compared to 2011 and cost of products increased
$1.8 billion
, or
23%
, in
2012
compared to
2011. The increase in both equipment revenue and cost of products is primarily due to a higher average sales price and cost per device sold for postpaid and
prepaid devices, particularly driven by the introduction of the more expensive iPhone to postpaid and prepaid subscribers, partially offset by a decline in the
number of postpaid and prepaid devices sold.
Combined Year Ended December 31, 2013 and Predecessor Year Ended December 31, 2012
Equipment revenues for the combined year ended
December 31, 2013
as compared to the Predecessor year ended
December 31, 2012
increased
primarily due to higher average sales prices per postpaid and prepaid device sold as well as increases in prepaid volumes, partially offset by fewer postpaid
handsets sold. Cost of products decreased primarily from fewer postpaid handsets sold although at a higher average cost per handset, partially offset by an
increase in average cost per prepaid handset due to increased sales of more expensive 4G and LTE devices combined with fewer sales of low cost Assurance
wireless handsets.
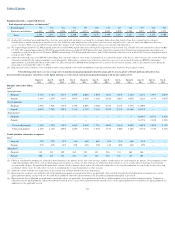
Selling, General and Administrative Expense
Sales and marketing costs primarily consist of subscriber acquisition costs, including commissions paid to our indirect dealers, third
-
party
distributors and retail sales force for new device activations and upgrades, residual payments to our indirect dealers, payments made to OEMs for direct source
equipment, payroll and facilities costs associated with our retail sales force, marketing employees, advertising, media programs and sponsorships, including
costs related to branding. General and administrative expenses primarily consist of costs for billing, customer care and information technology operations, bad
debt expense and administrative support activities, including collections, legal, finance, human resources, corporate communications, strategic planning, and
technology and product development.
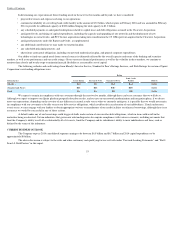
Successor Year Ended December 31, 2013 and Predecessor Years Ended December 31, 2012 and 2011
Sales and marketing expense was
$2.6 billion
for the Successor year ended
December 31, 2013
representing a decrease of
$2.6 billion
, or
50%
, as
compared to the Predecessor year ended
December 31, 2012
primarily due to comparing operating results for the shortened Post
-
merger period to the
2012
Predecessor period consisting of a full calendar year. In addition, we had a reduction in commissions expense resulting from our decrease in postpaid subscriber
gross additions, which was was partially offset by increased costs resulting from the Clearwire Acquisition and higher media spend.
Sales and marketing expense was
$5.3 billion
, an increase of
$165 million
, or 3%
, in
2012
from 2011 primarily due to increased reimbursements for
point
-
of
-
sale discounts for iPhones of $238 million, which are
45