Sprint - Nextel 2013 Annual Report Download - page 161
Download and view the complete annual report
Please find page 161 of the 2013 Sprint - Nextel annual report below. You can navigate through the pages in the report by either clicking on the pages listed below, or by using the keyword search tool below to find specific information within the annual report.-
 1
1 -
2
-
3
-
4
-
5
-
6
-
7
-
8
-
9
-
10
-
11
-
12
-
13
-
14
-
15
-
16
-
17
-
18
-
19
-
20
-
21
-
22
-
23
-
24
-
25
-
26
-
27
-
28
-
29
-
30
-
31
-
32
-
33
-
34
-
35
-
36
-
37
-
38
-
39
-
40
-
41
-
42
-
43
-
44
-
45
-
46
-
47
-
48
-
49
-
50
-
51
-
52
-
53
-
54
-
55
-
56
-
57
-
58
-
59
-
60
-
61
-
62
-
63
-
64
-
65
-
66
-
67
-
68
-
69
-
70
-
71
-
72
-
73
-
74
-
75
-
76
-
77
-
78
-
79
-
80
-
81
-
82
-
83
-
84
-
85
-
86
-
87
-
88
-
89
-
90
-
91
-
92
-
93
-
94
-
95
-
96
-
97
-
98
-
99
-
100
-
101
-
102
-
103
-
104
-
105
-
106
-
107
-
108
-
109
-
110
-
111
-
112
-
113
-
114
-
115
-
116
-
117
-
118
-
119
-
120
-
121
-
122
-
123
-
124
-
125
-
126
-
127
-
128
-
129
-
130
-
131
-
132
-
133
-
134
-
135
-
136
-
137
-
138
-
139
-
140
-
141
-
142
-
143
-
144
-
145
-
146
-
147
-
148
-
149
-
150
-
 151
151 -
 152
152 -
 153
153 -
 154
154 -
 155
155 -
 156
156 -
 157
157 -
 158
158 -
 159
159 -
 160
160 -
 161
161 -
 162
162 -
 163
163 -
 164
164 -
 165
165 -
 166
166 -
 167
167 -
 168
168 -
 169
169 -
 170
170 -
 171
171 -
172
-
173
-
174
-
175
-
176
-
177
-
178
-
179
-
180
-
181
-
182
-
183
-
184
-
185
-
186
-
187
-
188
-
189
-
190
-
191
-
192
-
193
-
194
-
195
-
196
-
197
-
198
-
199
-
200
-
201
-
202
-
203
-
204
-
205
-
206
-
207
-
208
-
209
-
210
-
211
-
212
-
213
-
214
-
215
-
216
-
217
-
218
-
219
-
220
-
221
-
222
-
223
-
224
-
225
-
226
-
227
-
228
-
229
-
230
-
231
-
232
-
233
-
234
-
235
-
236
-
237
-
238
-
239
-
240
-
241
-
242
-
243
-
244
-
245
-
246
-
247
-
248
-
249
-
250
-
251
-
252
-
253
-
254
-
255
-
256
-
257
-
258
-
259
-
260
-
261
-
262
-
263
-
264
-
265
-
266
-
267
-
268
-
269
-
270
-
271
-
272
-
273
-
274
-
275
-
276
-
277
-
278
-
279
-
280
-
281
-
282
-
283
-
284
-
285
 |
 |

Table of Contents
Index to Consolidated Financial Statements
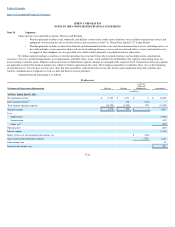
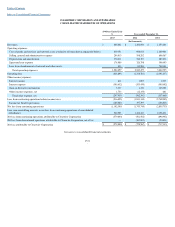
SPRINT CORPORATION
NOTES TO THE CONSOLIDATED FINANCIAL STATEMENTS
F
-
43
Statement of Operations Information
Wireless
Wireline
Corporate,
Other and
Eliminations
Consolidated
(in millions)
2012
Net operating revenues
$
32,355
$
2,999
$
12
$
35,366
Inter-segment revenues(1)
—
882
(882
)
—
Total segment operating expenses
(28,208
)
(3,232
)
877
(30,563
)
Segment earnings
$
4,147
$
649
$
7
4,803
Less:
Depreciation
(6,240
)
Amortization
(303
)
Business combination and hurricane-
related charges
(3)
(64
)
Other, net(2)
(16
)
Operating loss
(1,820
)
Interest expense
(1,428
)
Equity in losses of unconsolidated investments, net
$
(1,114
)
(1,114
)
Other income, net
190
Loss before income taxes
$
(4,172
)
Statement of Operations Information
Wireless
Wireline
Corporate,
Other and
Eliminations
Consolidated
(in millions)
2011
Net operating revenues
$
30,301
$
3,370
$
8
$
33,679
Inter-segment revenues(1)
—
956
(956
)
—
Total segment operating expenses
(26,034
)
(3,526
)
953
(28,607
)
Segment earnings
$
4,267
$
800
$
5
5,072
Less:
Depreciation
(4,455
)
Amortization
(403
)
Other, net(2)
(106
)
Operating income
108
Interest expense
(1,011
)
Equity in losses of unconsolidated investments, net
$
(1,730
)
(1,730
)
Other expense, net
(3
)
Loss before income taxes
$
(2,636
)
Other Information
Wireless
Wireline
Corporate and
Other
Consolidated
(in millions)
Capital expenditures for the 191 days ended July 10, 2013
$
2,840
$
174
$
126
$
3,140
2012
Capital expenditures
$
3,753
$
240
$
268
$
4,261
Total assets
$
38,297
$
2,195
$
11,078
$
51,570
2011
Capital expenditures
$
2,702
$
168
$
260
$
3,130
Total assets
$
37,606
$
2,355
$
9,422
$
49,383