Starbucks 2009 Annual Report Download - page 10
Download and view the complete annual report
Please find page 10 of the 2009 Starbucks annual report below. You can navigate through the pages in the report by either clicking on the pages listed below, or by using the keyword search tool below to find specific information within the annual report.-
 1
1 -
 2
2 -
 3
3 -
 4
4 -
 5
5 -
 6
6 -
 7
7 -
 8
8 -
 9
9 -
 10
10 -
 11
11 -
 12
12 -
 13
13 -
 14
14 -
 15
15 -
 16
16 -
 17
17 -
 18
18 -
 19
19 -
 20
20 -
 21
21 -
22
-
23
-
24
-
25
-
26
-
27
-
28
-
29
-
30
-
31
-
32
-
33
-
34
-
35
-
36
-
37
-
38
-
39
-
40
-
41
-
42
-
43
-
44
-
45
-
46
-
47
-
48
-
49
-
50
-
51
-
52
-
53
-
54
-
55
-
56
-
57
-
58
-
59
-
60
-
61
-
62
-
63
-
64
-
65
-
66
-
67
-
68
-
69
-
70
-
71
-
72
-
73
-
74
-
75
-
76
-
77
-
78
-
79
-
80
-
81
-
82
-
83
-
84
-
85
-
86
-
87
-
88
-
89
-
90
-
91
-
92
-
93
-
94
-
95
-
96
-
97
-
98
 |
 |

Revenue Components
Revenue components as a percentage of total net revenues and related specialty revenues for the fiscal year ended
September 27, 2009:
Revenues
%of
Total Net
Revenues
%of
Specialty
Revenues
Company-operated retail ......................................... 84%
Specialty:
Licensing:
Retail stores .............................................. 8 50%
Packaged coffee and tea...................................... 4 23
Branded products........................................... ⬍14
Total licensing............................................... 12 77
Foodservice and other:
Foodservice ............................................... 4 23
Other initiatives ............................................ ⬍1⬍1
Total foodservice and other ..................................... 4 23
Total specialty . ............................................... 16 100%
Total net revenues .............................................. 100%
Company-operated and Licensed Retail Store Summary as of September 27, 2009
US As a% of Total
US Stores International
As a% of Total
International
Stores Total As a% of
Total Stores
Company-operated stores.... 6,764 61% 2,068 38% 8,832 53%
Licensed stores ........... 4,364 39 3,439 62 7,803 47
Total................. 11,128 100%5,507 100%16,635 100%
Starbucks mix of Company-operated versus licensed stores in a given market will vary based on several factors.
Some of these factors include the ability to access desirable local retail space, the complexity and expected ultimate
size of the market for Starbucks, and the ability to leverage the Company’s support infrastructure in an existing
geographic region.
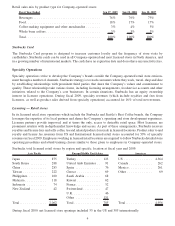
Company-operated Retail Stores
The Company’s retail goal is to become the leading retailer and brand of coffee in each of its target markets by
selling the finest quality coffee and related products, and by providing each customer a unique Starbucks
Experience. The Starbucks Experience is built upon superior customer service as well as clean and well-maintained
Company-operated retail stores that reflect the personalities of the communities in which they operate, thereby
building a high degree of customer loyalty.
Starbucks disciplined strategy for expanding its global retail business is to increase its market share by selectively
opening additional stores in existing markets, opening stores in new markets, and increasing sales in existing stores,
to support its long term strategic objectives. Store growth in specific existing markets will vary due to many factors,
including the maturity of the market.
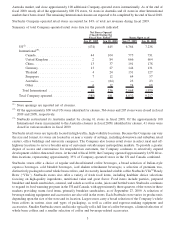
As described in more detail in Management’s Discussion and Analysis in this 10-K, Starbucks has taken a number of
actions in fiscal 2008 and 2009 to rationalize its store portfolio. These actions have included plans (announced in July
2008 and January 2009) to close a total of approximately 800 Company-operated stores in the US, restructure its
2