Starbucks 2009 Annual Report Download - page 34
Download and view the complete annual report
Please find page 34 of the 2009 Starbucks annual report below. You can navigate through the pages in the report by either clicking on the pages listed below, or by using the keyword search tool below to find specific information within the annual report.-
 1
1 -
2
-
3
-
4
-
5
-
6
-
7
-
8
-
9
-
10
-
11
-
12
-
13
-
14
-
15
-
16
-
17
-
18
-
19
-
20
-
21
-
22
-
23
-
 24
24 -
 25
25 -
 26
26 -
 27
27 -
 28
28 -
 29
29 -
 30
30 -
 31
31 -
 32
32 -
 33
33 -
 34
34 -
 35
35 -
 36
36 -
 37
37 -
 38
38 -
 39
39 -
 40
40 -
 41
41 -
 42
42 -
 43
43 -
 44
44 -
45
-
46
-
47
-
48
-
49
-
50
-
51
-
52
-
53
-
54
-
55
-
56
-
57
-
58
-
59
-
60
-
61
-
62
-
63
-
64
-
65
-
66
-
67
-
68
-
69
-
70
-
71
-
72
-
73
-
74
-
75
-
76
-
77
-
78
-
79
-
80
-
81
-
82
-
83
-
84
-
85
-
86
-
87
-
88
-
89
-
90
-
91
-
92
-
93
-
94
-
95
-
96
-
97
-
98
 |
 |

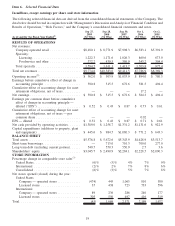
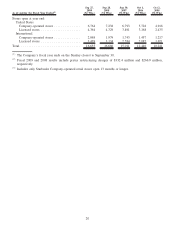
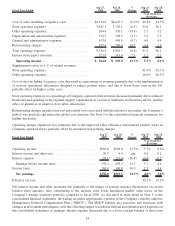
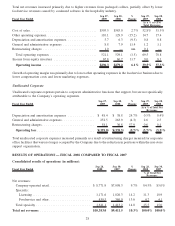
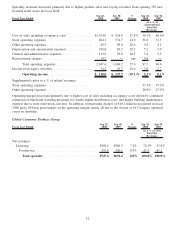
Company-operated retail revenues decreased year over year primarily due to a 6% decrease in comparable store
sales, comprised of a 4% decrease in transactions, and a 2% decrease in average value per transaction.
Fiscal Year Ended Sep 27,
2009 Sep 28,
2008 %
Change Sep 27,
2009 Sep 28,
2008
As a % of US Total
Net Revenues
Cost of sales including occupancy costs .............. $2,965.7 $3,206.3 (7.5)% 41.7% 42.6%
Store operating expenses ......................... 2,815.1 3,081.0 (8.6) 39.6 40.9
Other operating expenses ......................... 81.4 111.7 (27.1) 1.1 1.5
Depreciation and amortization expenses .............. 378.1 395.4 (4.4) 5.3 5.2
General and administrative expenses ................ 86.7 71.2 21.8 1.2 0.9
Restructuring charges............................ 246.3 210.9 16.8 3.5 2.8
Total operating expenses ....................... 6,573.3 7,076.5 (7.1) 92.5 94.0
Income (loss) from equity investees ................. 0.5 (1.3) nm — —
Operating income............................ $ 531.8 $ 454.2 17.1% 7.5% 6.0%
Supplemental ratios as a % of related revenues:
Store operating expenses ......................... 42.8% 44.0%
Other operating expenses ......................... 15.3% 20.9%
Operating margin expanded primarily due to lower store operating expenses, lower cost of sales including
occupancy costs, and lower other operating expenses as a percentage of total revenues. This improvement was
primarily due to operational changes designed to improve labor efficiency and reduce product waste in Company-
operated stores, and to lower non-store support costs. Partially offsetting the favorability were higher restructuring
charges during the year. The Company incurred higher lease exit and related costs due to the higher number of
actual store closures compared to the prior year period.
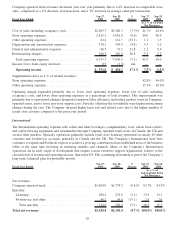
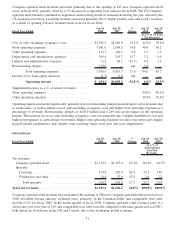
International
The International operating segment sells coffee and other beverages, complementary food, whole bean coffees,
and coffee brewing equipment and merchandise through Company-operated retail stores in Canada, the UK and
several other markets. Specialty operations primarily include retail store licensing operations in nearly 40 other
countries and foodservice accounts, primarily in Canada and the UK. The Company’s International store base
continues to expand and Starbucks expects to achieve a growing contribution from established areas of the business
while at the same time investing in emerging markets and channels. Many of the Company’s International
operations are in early stages of development that require a more extensive support organization, relative to the
current levels of revenue and operating income, than in the US. This continuing investment is part of the Company’s
long-term, balanced plan for profitable growth.
Fiscal Year Ended Sep 27,
2009 Sep 28,
2008 %
Change Sep 27,
2009 Sep 28,
2008
As a % of
International Total
Net Revenues
Net revenues:
Company-operated retail ......................... $1,608.0 $1,774.2 (9.4)% 83.7% 84.3%
Specialty:
Licensing................................... 266.2 274.8 (3.1) 13.9 13.1
Foodservice and other ......................... 46.2 54.4 (15.1) 2.4 2.6
Total specialty ............................. 312.4 329.2 (5.1) 16.3 15.7
Total net revenues ............................. $1,920.4 $2,103.4 (8.7)% 100.0% 100.0%
26