Starbucks 2009 Annual Report Download - page 38
Download and view the complete annual report
Please find page 38 of the 2009 Starbucks annual report below. You can navigate through the pages in the report by either clicking on the pages listed below, or by using the keyword search tool below to find specific information within the annual report.-
 1
1 -
2
-
3
-
4
-
5
-
6
-
7
-
8
-
9
-
10
-
11
-
12
-
13
-
14
-
15
-
16
-
17
-
18
-
19
-
20
-
21
-
22
-
23
-
24
-
25
-
26
-
27
-
 28
28 -
 29
29 -
 30
30 -
 31
31 -
 32
32 -
 33
33 -
 34
34 -
 35
35 -
 36
36 -
 37
37 -
 38
38 -
 39
39 -
 40
40 -
 41
41 -
 42
42 -
 43
43 -
 44
44 -
 45
45 -
 46
46 -
 47
47 -
 48
48 -
49
-
50
-
51
-
52
-
53
-
54
-
55
-
56
-
57
-
58
-
59
-
60
-
61
-
62
-
63
-
64
-
65
-
66
-
67
-
68
-
69
-
70
-
71
-
72
-
73
-
74
-
75
-
76
-
77
-
78
-
79
-
80
-
81
-
82
-
83
-
84
-
85
-
86
-
87
-
88
-
89
-
90
-
91
-
92
-
93
-
94
-
95
-
96
-
97
-
98
 |
 |

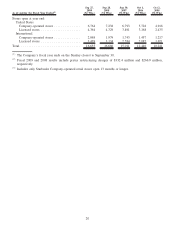
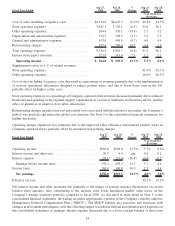
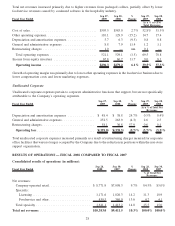
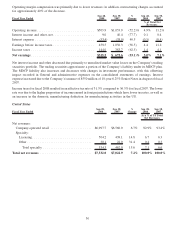
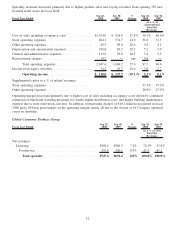
Operating margin compression was primarily due to lower revenues; in addition, restructuring charges accounted
for approximately 40% of the decrease.
Fiscal Year Ended Sep 28,
2008 Sep 30,
2007 %
Change Sep 28,
2008 Sep 30,
2007
% of Total Net
Revenues
Operating income................................ $503.9 $1,053.9 (52.2)% 4.9% 11.2%
Interest income and other, net ....................... 9.0 40.4 (77.7) 0.1 0.4
Interest expense ................................. (53.4) (38.0) 40.5 (0.5) (0.4)
Earnings before income taxes ....................... 459.5 1,056.3 (56.5) 4.4 11.2
Income taxes ................................... 144.0 383.7 (62.5) 1.4 4.1
Net earnings ................................... $315.5 $ 672.6 (53.1)% 3.0% 7.1%
Net interest income and other decreased due primarily to unrealized market value losses on the Company’s trading
securities portfolio. The trading securities approximate a portion of the Company’s liability under its MDCP plan.
The MDCP liability also increases and decreases with changes in investment performance, with this offsetting
impact recorded in General and administrative expenses on the consolidated statements of earnings. Interest
expense increased due to the Company’s issuance of $550 million of 10-year 6.25% Senior Notes in August of fiscal
2007.
Income taxes for fiscal 2008 resulted in an effective tax rate of 31.3% compared to 36.3% for fiscal 2007. The lower
rate was due to the higher proportion of income earned in foreign jurisdictions which have lower tax rates, as well as
an increase in the domestic manufacturing deduction for manufacturing activities in the US.
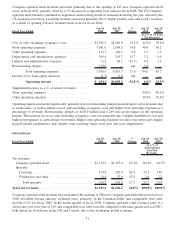
United States
Fiscal Year Ended Sep 28,
2008 Sep 30,
2007 %
Change Sep 28,
2008 Sep 30,
2007
As a % of US Total
Net Revenues
Net revenues:
Company-operated retail ....................... $6,997.7 $6,560.9 6.7% 92.9% 93.4%
Specialty:
Licensing ................................. 504.2 439.1 14.8 6.7 6.3
Other .................................... 30.1 22.9 31.4 0.4 0.3
Total specialty ........................... 534.3 462.0 15.6 7.1 6.6
Total net revenues ............................. $7,532.0 $7,022.9 7.2% 100.0% 100.0%
30