Starbucks 2009 Annual Report Download - page 83
Download and view the complete annual report
Please find page 83 of the 2009 Starbucks annual report below. You can navigate through the pages in the report by either clicking on the pages listed below, or by using the keyword search tool below to find specific information within the annual report.-
 1
1 -
2
-
3
-
4
-
5
-
6
-
7
-
8
-
9
-
10
-
11
-
12
-
13
-
14
-
15
-
16
-
17
-
18
-
19
-
20
-
21
-
22
-
23
-
24
-
25
-
26
-
27
-
28
-
29
-
30
-
31
-
32
-
33
-
34
-
35
-
36
-
37
-
38
-
39
-
40
-
41
-
42
-
43
-
44
-
45
-
46
-
47
-
48
-
49
-
50
-
51
-
52
-
53
-
54
-
55
-
56
-
57
-
58
-
59
-
60
-
61
-
62
-
63
-
64
-
65
-
66
-
67
-
68
-
69
-
70
-
71
-
72
-
 73
73 -
 74
74 -
 75
75 -
 76
76 -
 77
77 -
 78
78 -
 79
79 -
 80
80 -
 81
81 -
 82
82 -
 83
83 -
 84
84 -
 85
85 -
 86
86 -
 87
87 -
 88
88 -
 89
89 -
 90
90 -
 91
91 -
 92
92 -
 93
93 -
94
-
95
-
96
-
97
-
98
 |
 |

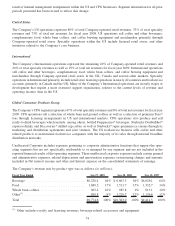
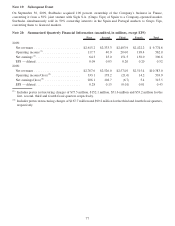
The tables below represent information by geographic area (in millions):
Fiscal Year Ended Sep 27, 2009 Sep 28, 2008 Sep 30, 2007
Net revenues from external customers:
United States .......................................... $7,787.7 $ 8,227.0 $7,678.9
Other countries ........................................ 1,986.9 2,156.0 1,732.6
Total . . .............................................. $9,774.6 $10,383.0 $9,411.5
No customer accounts for 10% or more of the Company’s revenues. Revenues are shown based on the geographic
location of the customers. Revenues from countries other than the US consist primarily of revenues from Canada
and the UK, which together account for approximately 66% of net revenues from other countries for fiscal 2009.
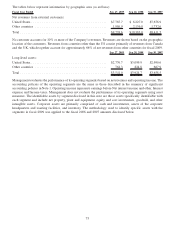
Sep 27, 2009 Sep 28, 2008 Sep 30, 2007
Long-lived assets:
United States .......................................... $2,776.7 $3,099.9 $2,990.6
Other countries ........................................ 764.3 824.8 667.9
Total . . .............................................. $3,541.0 $3,924.7 $3,658.5
Management evaluates the performance of its operating segments based on net revenues and operating income. The
accounting policies of the operating segments are the same as those described in the summary of significant
accounting policies in Note 1. Operating income represents earnings before Net interest income and other, Interest
expense and Income taxes. Management does not evaluate the performance of its operating segments using asset
measures. The identifiable assets by segment disclosed in this note are those assets specifically identifiable with
each segment and include net property, plant and equipment, equity and cost investments, goodwill, and other
intangible assets. Corporate assets are primarily comprised of cash and investments, assets of the corporate
headquarters and roasting facilities, and inventory. The methodology used to identify specific assets with the
segments in fiscal 2009 was applied to the fiscal 2008 and 2007 amounts disclosed below.
75