Starbucks 2009 Annual Report Download - page 41
Download and view the complete annual report
Please find page 41 of the 2009 Starbucks annual report below. You can navigate through the pages in the report by either clicking on the pages listed below, or by using the keyword search tool below to find specific information within the annual report.-
 1
1 -
2
-
3
-
4
-
5
-
6
-
7
-
8
-
9
-
10
-
11
-
12
-
13
-
14
-
15
-
16
-
17
-
18
-
19
-
20
-
21
-
22
-
23
-
24
-
25
-
26
-
27
-
28
-
29
-
30
-
 31
31 -
 32
32 -
 33
33 -
 34
34 -
 35
35 -
 36
36 -
 37
37 -
 38
38 -
 39
39 -
 40
40 -
 41
41 -
 42
42 -
 43
43 -
 44
44 -
 45
45 -
 46
46 -
 47
47 -
 48
48 -
 49
49 -
 50
50 -
 51
51 -
52
-
53
-
54
-
55
-
56
-
57
-
58
-
59
-
60
-
61
-
62
-
63
-
64
-
65
-
66
-
67
-
68
-
69
-
70
-
71
-
72
-
73
-
74
-
75
-
76
-
77
-
78
-
79
-
80
-
81
-
82
-
83
-
84
-
85
-
86
-
87
-
88
-
89
-
90
-
91
-
92
-
93
-
94
-
95
-
96
-
97
-
98
 |
 |

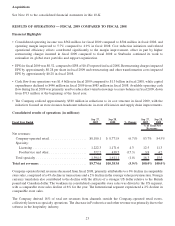
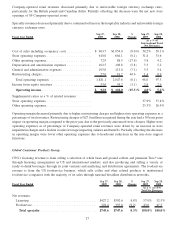
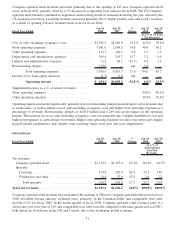
Foodservice revenues increased primarily due to growth in new and existing foodservice accounts, and licensing
revenue increased due to higher royalties and product sales in the international ready-to-drink business and
increased sales of US packaged tea and International club packaged coffee.
Fiscal Year Ended Sep 28,
2008 Sep 30,
2007 %
Change Sep 28,
2008 Sep 30,
2007
As a % of CPG
Total Net
Revenues
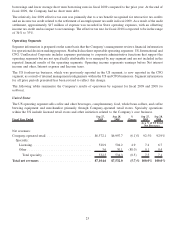
Cost of sales . . . .................................. $385.0 $370.5 3.9% 51.5% 53.5%
Other operating expenses............................ 129.9 119.8 8.4 17.4 17.3
Depreciation and amortization expenses................. 6.3 6.6 (4.5) 0.8 1.0
General and administrative expenses ................... 7.9 8.1 (2.5) 1.1 1.2
Total operating expenses ...................... 529.1 505.0 4.8 70.8 72.9
Income from equity investees ........................ 60.7 61.5 (1.3) 8.1 8.9
Operating income........................... $279.2 $248.9 12.2% 37.3% 35.9%
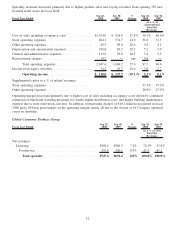
Growth of operating margin was primarily due to lower cost of sales as a percentage of revenues, partially offset by
lower income from equity investees. Lower cost of sales was primarily due to a sales mix shift to more profitable
products.
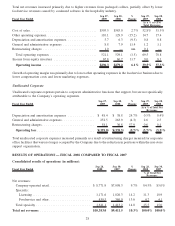
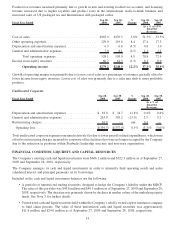
Unallocated Corporate
Fiscal Year Ended Sep 28,
2008 Sep 30,
2007 %
Change Sep 28,
2008 Sep 30,
2007
As a % of
Total Net
Revenues
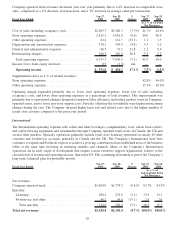
Depreciation and amortization expenses ............... $ 38.8 $ 34.7 11.8% 0.4% 0.4%
General and administrative expenses .................. 263.9 303.2 (13.0) 2.5 3.2
Restructuring charges ............................. 36.8 — nm 0.4 —
Operating loss................................. $(339.5) $(337.9) 0.5% (3.3)% (3.6)%
Total unallocated corporate expenses remained relatively flat due to lower payroll-related expenditures, which were
offset by restructuring charges incurred for corporate office facilities that were no longer occupied by the Company
due to the reduction in positions within Starbucks leadership structure and non-store organization.
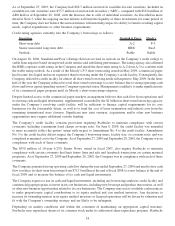
FINANCIAL CONDITION, LIQUIDITY AND CAPITAL RESOURCES
The Company’s existing cash and liquid investments were $666.1 million and $322.3 million as of September 27,
2009 and September 28, 2008, respectively.
The Company manages its cash and liquid investments in order to internally fund operating needs and make
scheduled interest and principal payments on its borrowings.
Included in the cash and liquid investment balances are the following:
• A portfolio of unrestricted trading securities, designed to hedge the Company’s liability under the MDCP.
The value of this portfolio was $44.8 million and $49.5 million as of September 27, 2009 and September 28,
2008, respectively. The decrease was primarily driven by declines in market values of the underlying equity
funds. See Note 3 for further details.
• Unrestricted cash and liquid securities held within the Company’s wholly owned captive insurance company
to fund claim payouts. The value of these unrestricted cash and liquid securities was approximately
$11.8 million and $24.0 million as of September 27, 2009 and September 28, 2008, respectively.
33