Starbucks 2009 Annual Report Download - page 73
Download and view the complete annual report
Please find page 73 of the 2009 Starbucks annual report below. You can navigate through the pages in the report by either clicking on the pages listed below, or by using the keyword search tool below to find specific information within the annual report.-
 1
1 -
2
-
3
-
4
-
5
-
6
-
7
-
8
-
9
-
10
-
11
-
12
-
13
-
14
-
15
-
16
-
17
-
18
-
19
-
20
-
21
-
22
-
23
-
24
-
25
-
26
-
27
-
28
-
29
-
30
-
31
-
32
-
33
-
34
-
35
-
36
-
37
-
38
-
39
-
40
-
41
-
42
-
43
-
44
-
45
-
46
-
47
-
48
-
49
-
50
-
51
-
52
-
53
-
54
-
55
-
56
-
57
-
58
-
59
-
60
-
61
-
62
-
 63
63 -
 64
64 -
 65
65 -
 66
66 -
 67
67 -
 68
68 -
 69
69 -
 70
70 -
 71
71 -
 72
72 -
 73
73 -
 74
74 -
 75
75 -
 76
76 -
 77
77 -
 78
78 -
 79
79 -
 80
80 -
 81
81 -
 82
82 -
 83
83 -
84
-
85
-
86
-
87
-
88
-
89
-
90
-
91
-
92
-
93
-
94
-
95
-
96
-
97
-
98
 |
 |

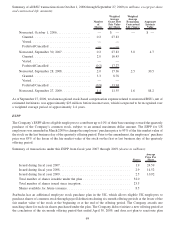
Share repurchase activity was as follows (in millions, except for average price data):
Fiscal Year Ending Sep 27, 2009 Sep 28, 2008
Number of shares acquired ................................... — 12.2
Average price per share of acquired shares........................ — $24.12
Total accrual-based cost of acquired shares ....................... — $295.3
Total cash-based cost of acquired shares ......................... — $311.4
The difference between the accrual-based and cash-based cost of acquired shares represents the effect of the net
change in unsettled trades from the prior fiscal year end.
As of September 27, 2009, 6.3 million shares remained available for repurchase under current authorizations.
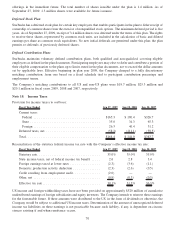
Comprehensive Income
Comprehensive income includes all changes in equity during the period, except those resulting from transactions
with shareholders of the Company. It has two components: net earnings and other comprehensive income.
Accumulated other comprehensive income reported on the Company’s consolidated balance sheets consists of
foreign currency translation adjustments and the unrealized gains and losses, net of applicable taxes, on
available-for-sale securities and on derivative instruments designated and qualifying as cash flow and net
investment hedges.
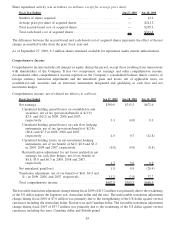
Comprehensive income, net of related tax effects (in millions):
Fiscal Year Ended Sep 27, 2009 Sep 28, 2008 Sep 30, 2007
Net earnings ................................... $390.8 $315.5 $672.6
Unrealized holding gains/(losses) on available-for-sale
securities, net of tax (provision)/benefit of $(1.9),
$2.4, and ($0.2) in 2009, 2008 and 2007,
respectively ................................ 3.3 (4.0) 0.3
Unrealized holding gains/(losses) on cash flow hedging
instruments, net of tax (provision)/benefit of $(2.4),
($0.4) and $7.5 in 2009, 2008 and 2007,
respectively ................................ 4.0 0.7 (12.8)
Unrealized holding losses on net investment hedging
instruments, net of tax benefit of $4.0, $0.6 and $5.2
in 2009, 2008 and 2007, respectively ............. (6.8) (0.9) (8.8)
Reclassification adjustment for net losses realized in net
earnings for cash flow hedges, net of tax benefit of
$0.8, $3.0 and $0.5 in 2009, 2008 and 2007,
respectively ................................ 1.3 5.0 0.9
Net unrealized gain/(loss) ......................... 1.8 0.8 (20.4)
Translation adjustment, net of tax benefit of $6.0, $0.3 and
$— in 2009, 2008, and 2007, respectively............ 15.2 (7.0) 37.7
Total comprehensive income ....................... $407.8 $309.3 $689.9
The favorable translation adjustment change during fiscal 2009 of $15.2 million was primarily due tothe weakening
of the US dollar against the Japanese yen, Australian dollar and the euro. The unfavorable translation adjustment
change during fiscal 2008 of $7.0 million was primarily due to the strengthening of the US dollar against several
currencies including the Australian dollar, Korean won and Canadian dollar. The favorable translation adjustment
change during fiscal 2007 of $37.7 million was primarily due to the weakening of the US dollar against several
currencies including the euro, Canadian dollar and British pound.
65