Starbucks 2009 Annual Report Download - page 36
Download and view the complete annual report
Please find page 36 of the 2009 Starbucks annual report below. You can navigate through the pages in the report by either clicking on the pages listed below, or by using the keyword search tool below to find specific information within the annual report.-
 1
1 -
2
-
3
-
4
-
5
-
6
-
7
-
8
-
9
-
10
-
11
-
12
-
13
-
14
-
15
-
16
-
17
-
18
-
19
-
20
-
21
-
22
-
23
-
24
-
25
-
 26
26 -
 27
27 -
 28
28 -
 29
29 -
 30
30 -
 31
31 -
 32
32 -
 33
33 -
 34
34 -
 35
35 -
 36
36 -
 37
37 -
 38
38 -
 39
39 -
 40
40 -
 41
41 -
 42
42 -
 43
43 -
 44
44 -
 45
45 -
 46
46 -
47
-
48
-
49
-
50
-
51
-
52
-
53
-
54
-
55
-
56
-
57
-
58
-
59
-
60
-
61
-
62
-
63
-
64
-
65
-
66
-
67
-
68
-
69
-
70
-
71
-
72
-
73
-
74
-
75
-
76
-
77
-
78
-
79
-
80
-
81
-
82
-
83
-
84
-
85
-
86
-
87
-
88
-
89
-
90
-
91
-
92
-
93
-
94
-
95
-
96
-
97
-
98
 |
 |

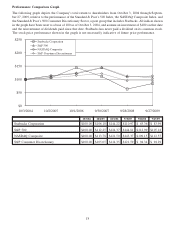
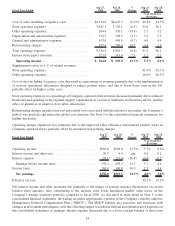
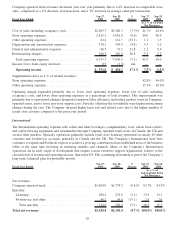
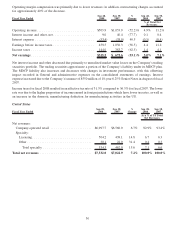
Total net revenues increased primarily due to higher revenues from packaged coffees, partially offset by lower
foodservice revenues caused by continued softness in the hospitality industry.
Fiscal Year Ended Sep 27,
2009 Sep 28,
2008 %
Change Sep 27,
2009 Sep 28,
2008
As a % of CPG
Total Revenues
Cost of sales . . . .................................. $395.5 $385.0 2.7% 52.8% 51.5%
Other operating expenses............................ 110.1 129.9 (15.2) 14.7 17.4
Depreciation and amortization expenses................. 5.7 6.3 (9.5) 0.8 0.8
General and administrative expenses ................... 8.8 7.9 11.4 1.2 1.1
Restructuring charges .............................. 1.0 — nm 0.1 —
Total operating expenses .......................... 521.1 529.1 (1.5) 69.5 70.8
Income from equity investees ........................ 67.8 60.7 11.7 9.0 8.1
Operating income .............................. $296.3 $279.2 6.1% 39.5% 37.3%
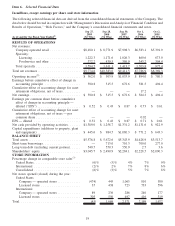
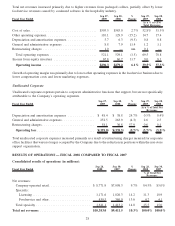
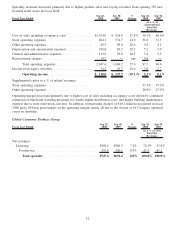
Growth of operating margin was primarily due to lower other operating expenses in the foodservice business due to
lower compensation costs and lower marketing expenses.
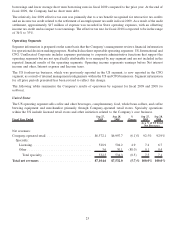
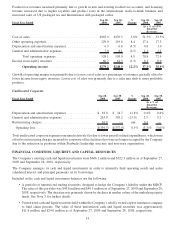
Unallocated Corporate
Unallocated corporate expenses pertain to corporate administrative functions that support, but are not specifically
attributable to the Company’s operating segments.
Fiscal Year Ended Sep 27,
2009 Sep 28,
2008 %
Change Sep 27,
2009 Sep 28,
2008
As a % of Total Net
Revenues
Depreciation and amortization expenses ............... $ 48.4 $ 38.8 24.7% 0.5% 0.4%
General and administrative expenses .................. 252.5 263.9 (4.3) 2.6 2.5
Restructuring charges ............................. 58.1 36.8 57.9 0.6 0.4
Operating loss ................................ $(359.0) $(339.5) (5.7)% (3.7)% (3.3)%
Total unallocated corporate expenses increased primarily as a result of restructuring charges incurred for corporate
office facilities that were no longer occupied by the Company due to the reduction in positions within the non-store
support organization.
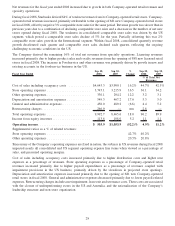
RESULTS OF OPERATIONS — FISCAL 2008 COMPARED TO FISCAL 2007
Consolidated results of operations (in millions):
Fiscal Year Ended Sep 28,
2008 Sep 30,
2007 %
Change Sep 28,
2008 Sep 30,
2007
% of Total Net
Revenues
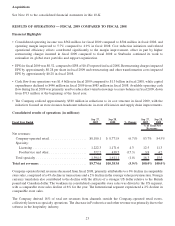
Net revenues:
Company-operated retail....................... $ 8,771.9 $7,998.3 9.7% 84.5% 85.0%
Specialty:
Licensing ................................ 1,171.6 1,026.3 14.2 11.3 10.9
Foodservice and other....................... 439.5 386.9 13.6 4.2 4.1
Total specialty .............................. 1,611.1 1,413.2 14.0 15.5 15.0
Total net revenues ............................ $10,383.0 $9,411.5 10.3% 100.0% 100.0%
28