Starbucks 2009 Annual Report Download - page 37
Download and view the complete annual report
Please find page 37 of the 2009 Starbucks annual report below. You can navigate through the pages in the report by either clicking on the pages listed below, or by using the keyword search tool below to find specific information within the annual report.-
 1
1 -
2
-
3
-
4
-
5
-
6
-
7
-
8
-
9
-
10
-
11
-
12
-
13
-
14
-
15
-
16
-
17
-
18
-
19
-
20
-
21
-
22
-
23
-
24
-
25
-
26
-
 27
27 -
 28
28 -
 29
29 -
 30
30 -
 31
31 -
 32
32 -
 33
33 -
 34
34 -
 35
35 -
 36
36 -
 37
37 -
 38
38 -
 39
39 -
 40
40 -
 41
41 -
 42
42 -
 43
43 -
 44
44 -
 45
45 -
 46
46 -
 47
47 -
48
-
49
-
50
-
51
-
52
-
53
-
54
-
55
-
56
-
57
-
58
-
59
-
60
-
61
-
62
-
63
-
64
-
65
-
66
-
67
-
68
-
69
-
70
-
71
-
72
-
73
-
74
-
75
-
76
-
77
-
78
-
79
-
80
-
81
-
82
-
83
-
84
-
85
-
86
-
87
-
88
-
89
-
90
-
91
-
92
-
93
-
94
-
95
-
96
-
97
-
98
 |
 |

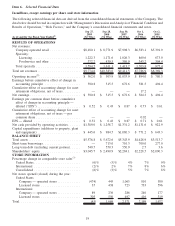
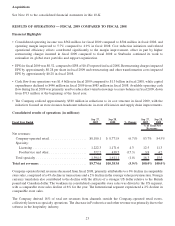
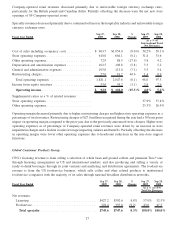
Net revenues for the fiscal year ended 2008 increased due to growth in both Company-operated retail revenues and
specialty operations.
During fiscal 2008, Starbucks derived 84% of total net revenues from its Company-operated retail stores. Company-
operated retail revenues increased, primarily attributable to the opening of 681 new Company-operated retail stores
in fiscal 2008, offset by negative 3%comparable store sales for the same period. Revenue growth was slower than in
previous years due to a combination of declining comparable store sales and a decrease in the number of net new
stores opened during fiscal 2008. The weakness in consolidated comparable store sales was driven by the US
segment, which posted a comparable store sales decline of 5% for the year. Partially offsetting this was 2%
comparable store sales growth in the International segment. Within fiscal 2008, consolidated quarterly revenue
growth decelerated each quarter and comparable store sales declined each quarter, reflecting the ongoing
challenging economic conditions in the US.
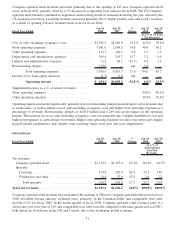
The Company derived the remaining 16% of total net revenues from specialty operations. Licensing revenues
increased primarily due to higher product sales and royalty revenues from the opening of 988 new licensed retail
stores in fiscal 2008. The increase in Foodservice and other revenues was primarily driven by growth in new and
existing accounts in the foodservice business in the US.
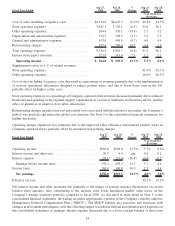
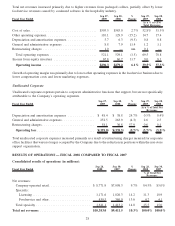
Fiscal Year Ended Sep 28,
2008 Sep 30,
2007 %
Change Sep 28,
2008 Sep 30,
2007
% of Total Net
Revenues
Cost of sales including occupancy costs ............ $4,645.3 $3,999.1 16.2% 44.7% 42.5%
Store operating expenses ........................ 3,745.1 3,215.9 16.5 36.1 34.2
Other operating expenses ........................ 330.1 294.2 12.2 3.2 3.1
Depreciation and amortization expenses ............. 549.3 467.2 17.6 5.3 5.0
General and administrative expenses................ 456.0 489.2 (6.8) 4.4 5.2
Restructuring charges........................... 266.9 — nm 2.6 —
Total operating expenses ........................ 9,992.7 8,465.6 18.0 96.2 89.9
Income from equity investees ..................... 113.6 108.0 5.2 1.1 1.1
Operating income............................. $ 503.9 $1,053.9 (52.2)% 4.9% 11.2%
Supplemental ratios as a % of related revenues:
Store operating expenses ........................ 42.7% 40.2%
Other operating expenses ........................ 20.5% 20.8%
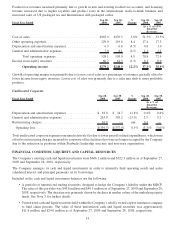
Since many of the Company’s operating expenses are fixed in nature, the softness in US revenues during fiscal 2008
impacted nearly all consolidated and US segment operating expense line items when viewed as a percentage of
sales, and pressured operating margins.
Cost of sales including occupancy costs increased primarily due to higher distribution costs and higher rent
expenses as a percentage of revenues. Store operating expenses as a percentage of Company-operated retail
revenues increased primarily due to higher payroll expenditures as a percentage of revenues coupled with
impairment provisions in the US business, primarily driven by the slowdown in projected store openings.
Depreciation and amortization expenses increased primarily due to the opening of 681 new Company-operated
retail stores in fiscal 2008. General and administrative expenses decreased primarily due to lower payroll-related
expenses. Restructuring charges include asset impairment, lease exit and severance costs. These costs are associated
with the closure of underperforming stores in the US and Australia, and the rationalization of the Company’s
leadership structure and non-store organization.
29