Starbucks 2009 Annual Report Download - page 69
Download and view the complete annual report
Please find page 69 of the 2009 Starbucks annual report below. You can navigate through the pages in the report by either clicking on the pages listed below, or by using the keyword search tool below to find specific information within the annual report.-
 1
1 -
2
-
3
-
4
-
5
-
6
-
7
-
8
-
9
-
10
-
11
-
12
-
13
-
14
-
15
-
16
-
17
-
18
-
19
-
20
-
21
-
22
-
23
-
24
-
25
-
26
-
27
-
28
-
29
-
30
-
31
-
32
-
33
-
34
-
35
-
36
-
37
-
38
-
39
-
40
-
41
-
42
-
43
-
44
-
45
-
46
-
47
-
48
-
49
-
50
-
51
-
52
-
53
-
54
-
55
-
56
-
57
-
58
-
 59
59 -
 60
60 -
 61
61 -
 62
62 -
 63
63 -
 64
64 -
 65
65 -
 66
66 -
 67
67 -
 68
68 -
 69
69 -
 70
70 -
 71
71 -
 72
72 -
 73
73 -
 74
74 -
 75
75 -
 76
76 -
 77
77 -
 78
78 -
 79
79 -
80
-
81
-
82
-
83
-
84
-
85
-
86
-
87
-
88
-
89
-
90
-
91
-
92
-
93
-
94
-
95
-
96
-
97
-
98
 |
 |

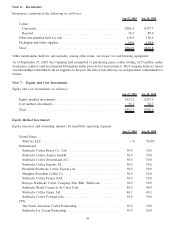
Starbucks has the ability to acquire additional interests in some of these cost method investees at certain intervals.
Depending on the Company’s total percentage of ownership interest and its ability to exercise significant influence
over financial and operating policies, additional investments may require the retroactive application of the equity
method of accounting.
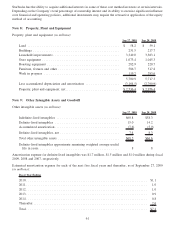
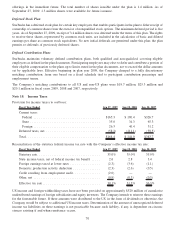
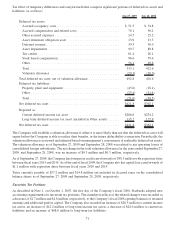
Note 8: Property, Plant and Equipment
Property, plant and equipment (in millions):
Sep 27, 2009 Sep 28, 2008
Land ................................................... $ 58.2 $ 59.1
Buildings ................................................ 231.5 217.7
Leasehold improvements . . ................................... 3,349.0 3,363.1
Store equipment ........................................... 1,073.4 1,045.3
Roasting equipment ........................................ 282.9 220.7
Furniture, fixtures and other .................................. 586.7 517.8
Work in progress .......................................... 119.2 293.6
5,700.9 5,717.3
Less accumulated depreciation and amortization ................... (3,164.5) (2,760.9)
Property, plant and equipment, net.............................. $2,536.4 $ 2,956.4
Note 9: Other Intangible Assets and Goodwill
Other intangible assets (in millions):
Sep 27, 2009 Sep 28, 2008
Indefinite-lived intangibles ................................... $60.8 $58.3
Definite-lived intangibles . ................................... 15.0 14.2
Accumulated amortization . ................................... (7.6) (5.9)
Definite-lived intangibles, net ................................. 7.4 8.3
Total other intangible assets .................................. $68.2 $66.6
Definite-lived intangibles approximate remaining weighted average useful
life in years............................................. 8 8
Amortization expense for definite-lived intangibles was $1.7 million, $1.5 million and $1.0 million during fiscal
2009, 2008 and 2007, respectively.
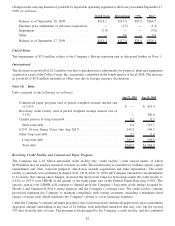
Estimated amortization expense for each of the next five fiscal years and thereafter, as of September 27, 2009
(in millions):
Fiscal Year Ending
2010 ................................................................... $1.1
2011 ................................................................... 1.0
2012 ................................................................... 1.0
2013 ................................................................... 0.9
2014 ................................................................... 0.8
Thereafter ............................................................... 2.6
Total ................................................................... $7.4
61