Starbucks 2009 Annual Report Download - page 31
Download and view the complete annual report
Please find page 31 of the 2009 Starbucks annual report below. You can navigate through the pages in the report by either clicking on the pages listed below, or by using the keyword search tool below to find specific information within the annual report.-
 1
1 -
2
-
3
-
4
-
5
-
6
-
7
-
8
-
9
-
10
-
11
-
12
-
13
-
14
-
15
-
16
-
17
-
18
-
19
-
20
-
 21
21 -
 22
22 -
 23
23 -
 24
24 -
 25
25 -
 26
26 -
 27
27 -
 28
28 -
 29
29 -
 30
30 -
 31
31 -
 32
32 -
 33
33 -
 34
34 -
 35
35 -
 36
36 -
 37
37 -
 38
38 -
 39
39 -
 40
40 -
 41
41 -
42
-
43
-
44
-
45
-
46
-
47
-
48
-
49
-
50
-
51
-
52
-
53
-
54
-
55
-
56
-
57
-
58
-
59
-
60
-
61
-
62
-
63
-
64
-
65
-
66
-
67
-
68
-
69
-
70
-
71
-
72
-
73
-
74
-
75
-
76
-
77
-
78
-
79
-
80
-
81
-
82
-
83
-
84
-
85
-
86
-
87
-
88
-
89
-
90
-
91
-
92
-
93
-
94
-
95
-
96
-
97
-
98
 |
 |

Acquisitions
See Note 19 to the consolidated financial statements in this 10-K.
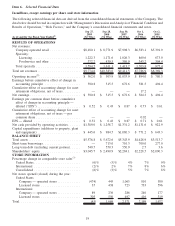
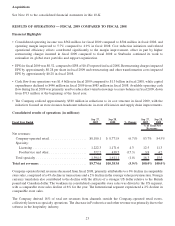
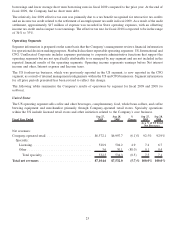
RESULTS OF OPERATIONS — FISCAL 2009 COMPARED TO FISCAL 2008
Financial Highlights
• Consolidated operating income was $562 million for fiscal 2009 compared to $504 million in fiscal 2008, and
operating margin improved to 5.7% compared to 4.9% in fiscal 2008. Cost reduction initiatives and related
operational efficiency efforts contributed significantly to the margin improvement, offset in part by higher
restructuring charges incurred in fiscal 2009 compared to fiscal 2008 as Starbucks continued its work to
rationalize its global store portfolio and support organization.
• EPS for fiscal 2009 was $0.52, compared to EPS of $0.43 reported in fiscal 2008. Restructuring charges impacted
EPS by approximately $0.28 per share in fiscal 2009 and restructuring and other transformation costs impacted
EPS by approximately $0.28 in fiscal 2008.
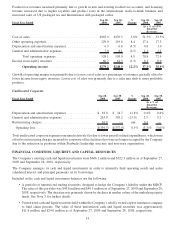
• Cash flow from operations was $1.4 billion in fiscal 2009 compared to $1.3 billion in fiscal 2008, while capital
expenditures declined to $446 million in fiscal 2009 from $985 million in fiscal 2008. Available operating cash
flow during fiscal 2009 was primarily used to reduce short-term borrowings to a zero balance in fiscal 2009, down
from $713 million at the beginning of the fiscal year.
• The Company realized approximately $580 million in reductions to its cost structure in fiscal 2009, with the
initiatives focused on store closures, headcount reductions, in-store efficiencies and supply chain improvements.
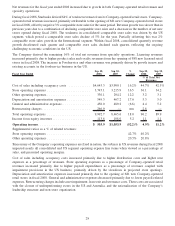
Consolidated results of operations (in millions):
Fiscal Year Ended Sep 27,
2009 Sep 28,
2008 % Change Sep 27,
2009 Sep 28,
2008
% of Total Net
Revenues
Net revenues:
Company-operated retail..................... $8,180.1 $ 8,771.9 (6.7)% 83.7% 84.5%
Specialty:
Licensing .............................. 1,222.3 1,171.6 4.3 12.5 11.3
Foodservice and other..................... 372.2 439.5 (15.3) 3.8 4.2
Total specialty ............................ 1,594.5 1,611.1 (1.0) 16.3 15.5
Total net revenues .......................... $9,774.6 $10,383.0 (5.9)% 100.0% 100.0%
Company-operated retail revenues decreased from fiscal 2008, primarily attributable to a 6% decline in comparable
store sales, comprised of a 4% decline in transactions and a 2% decline in the average value per transaction. Foreign
currency translation also contributed to the decline with the effects of a stronger US dollar relative to the British
pound and Canadian dollar. The weakness in consolidated comparable store sales was driven by the US segment,
with a comparable store sales decline of 6% for the year. The International segment experienced a 2% decline in
comparable store sales.
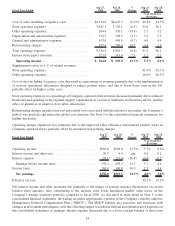
The Company derived 16% of total net revenues from channels outside the Company-operated retail stores,
collectively known as specialty operations. The decrease in Foodservice and other revenue was primarily due to the
softness in the hospitality industry.
23