Starbucks 2009 Annual Report Download - page 84
Download and view the complete annual report
Please find page 84 of the 2009 Starbucks annual report below. You can navigate through the pages in the report by either clicking on the pages listed below, or by using the keyword search tool below to find specific information within the annual report.-
 1
1 -
2
-
3
-
4
-
5
-
6
-
7
-
8
-
9
-
10
-
11
-
12
-
13
-
14
-
15
-
16
-
17
-
18
-
19
-
20
-
21
-
22
-
23
-
24
-
25
-
26
-
27
-
28
-
29
-
30
-
31
-
32
-
33
-
34
-
35
-
36
-
37
-
38
-
39
-
40
-
41
-
42
-
43
-
44
-
45
-
46
-
47
-
48
-
49
-
50
-
51
-
52
-
53
-
54
-
55
-
56
-
57
-
58
-
59
-
60
-
61
-
62
-
63
-
64
-
65
-
66
-
67
-
68
-
69
-
70
-
71
-
72
-
73
-
 74
74 -
 75
75 -
 76
76 -
 77
77 -
 78
78 -
 79
79 -
 80
80 -
 81
81 -
 82
82 -
 83
83 -
 84
84 -
 85
85 -
 86
86 -
 87
87 -
 88
88 -
 89
89 -
 90
90 -
 91
91 -
 92
92 -
 93
93 -
 94
94 -
95
-
96
-
97
-
98
 |
 |

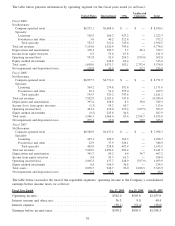
The table below presents information by operating segment for the fiscal years noted (in millions):
United States International CPG Unallocated
Corporate Total
Fiscal 2009:
Net Revenues:
Company-operated retail . . . . . . . . . . . . . . . . . . . $6,572.1 $1,608.0 $ — $ — $ 8,180.1
Specialty:
Licensing . . . . . . . . . . . . . . . . . . . . . . . . . . . . 528.9 266.2 427.2 — 1,222.3
Foodservice and other . . . . . . . . . . . . . . . . . . . 3.6 46.2 322.4 — 372.2
Total specialty . . . . . . . . . . . . . . . . . . . . . . . 532.5 312.4 749.6 — 1,594.5
Total net revenues . . . . . . . . . . . . . . . . . . . . . . . . . 7,104.6 1,920.4 749.6 — 9,774.6
Depreciation and amortization . . . . . . . . . . . . . . . . . 378.1 102.5 5.7 48.4 534.7
Income from equity investees . . . . . . . . . . . . . . . . . 0.5 53.6 67.8 — 121.9
Operating income/(loss) . . . . . . . . . . . . . . . . . . . . . 531.8 92.9 296.3 (359.0) 562.0
Equity method investments . . . . . . . . . . . . . . . . . . . — 248.8 64.4 — 313.2
Total assets . . . . . . . . . . . . . . . . . . . . . . . . . . . . . . 1,650.0 1,071.3 102.1 2,753.4 5,576.8
Net impairment and disposition losses . . . . . . . . . . . 120.8 45.9 — 57.7 224.4
Fiscal 2008:
Net Revenues:
Company-operated retail . . . . . . . . . . . . . . . . . . . $6,997.7 $1,774.2 $ — $ — $ 8,771.9
Specialty:
Licensing . . . . . . . . . . . . . . . . . . . . . . . . . . . . 504.2 274.8 392.6 — 1,171.6
Foodservice and other . . . . . . . . . . . . . . . . . . . 30.1 54.4 355.0 — 439.5
Total specialty . . . . . . . . . . . . . . . . . . . . . . . 534.3 329.2 747.6 — 1,611.1
Total net revenues . . . . . . . . . . . . . . . . . . . . . . . . . 7,532.0 2,103.4 747.6 — 10,383.0
Depreciation and amortization . . . . . . . . . . . . . . . . . 395.4 108.8 6.3 38.8 549.3
Income (loss) from equity investees . . . . . . . . . . . . . (1.3) 54.2 60.7 — 113.6
Operating income/(loss) . . . . . . . . . . . . . . . . . . . . . 454.2 110.0 279.2 (339.5) 503.9
Equity method investments . . . . . . . . . . . . . . . . . . . (0.5) 223.6 44.8 — 267.9
Total assets . . . . . . . . . . . . . . . . . . . . . . . . . . . . . . 1,966.3 1,066.0 85.6 2,554.7 5,672.6
Net impairment and disposition losses . . . . . . . . . . . 275.1 19.0 — 30.9 325.0
Fiscal 2007:
Net Revenues:
Company-operated retail . . . . . . . . . . . . . . . . . . . $6,560.9 $1,437.4 $ — $ — $ 7,998.3
Specialty:
Licensing . . . . . . . . . . . . . . . . . . . . . . . . . . . . 439.1 220.9 366.3 — 1,026.3
Foodservice and other . . . . . . . . . . . . . . . . . . . 22.9 37.9 326.1 — 386.9
Total specialty . . . . . . . . . . . . . . . . . . . . . . . 462.0 258.8 692.4 — 1,413.2
Total net revenues . . . . . . . . . . . . . . . . . . . . . . . . . 7,022.9 1,696.2 692.4 — 9,411.5
Depreciation and amortization . . . . . . . . . . . . . . . . . 341.7 84.2 6.6 34.7 467.2
Income from equity investees . . . . . . . . . . . . . . . . . 0.8 45.7 61.5 — 108.0
Operating income/(loss) . . . . . . . . . . . . . . . . . . . . . 1,005.2 137.7 248.9 (337.9) 1,053.9
Equity method investments . . . . . . . . . . . . . . . . . . . 0.8 196.9 36.8 — 234.5
Total assets . . . . . . . . . . . . . . . . . . . . . . . . . . . . . . 2,078.7 948.7 90.0 2,226.5 5,343.9
Net impairment and disposition losses . . . . . . . . . . . 9.3 15.1 — 1.6 26.0
The table below reconciles the total of the reportable segments’ operating income to the Company’s consolidated
earnings before income taxes (in millions):
Fiscal Year Ended Sep 27, 2009 Sep 28, 2008 Sep 30, 2007
Operating income....................................... $562.0 $503.9 $1,053.9
Interest income and other, net.............................. 36.3 9.0 40.4
Interest expense ........................................ (39.1) (53.4) (38.0)
Earnings before income taxes .............................. $559.2 $459.5 $1,056.3
76