Starbucks 2009 Annual Report Download - page 39
Download and view the complete annual report
Please find page 39 of the 2009 Starbucks annual report below. You can navigate through the pages in the report by either clicking on the pages listed below, or by using the keyword search tool below to find specific information within the annual report.-
 1
1 -
2
-
3
-
4
-
5
-
6
-
7
-
8
-
9
-
10
-
11
-
12
-
13
-
14
-
15
-
16
-
17
-
18
-
19
-
20
-
21
-
22
-
23
-
24
-
25
-
26
-
27
-
28
-
 29
29 -
 30
30 -
 31
31 -
 32
32 -
 33
33 -
 34
34 -
 35
35 -
 36
36 -
 37
37 -
 38
38 -
 39
39 -
 40
40 -
 41
41 -
 42
42 -
 43
43 -
 44
44 -
 45
45 -
 46
46 -
 47
47 -
 48
48 -
 49
49 -
50
-
51
-
52
-
53
-
54
-
55
-
56
-
57
-
58
-
59
-
60
-
61
-
62
-
63
-
64
-
65
-
66
-
67
-
68
-
69
-
70
-
71
-
72
-
73
-
74
-
75
-
76
-
77
-
78
-
79
-
80
-
81
-
82
-
83
-
84
-
85
-
86
-
87
-
88
-
89
-
90
-
91
-
92
-
93
-
94
-
95
-
96
-
97
-
98
 |
 |

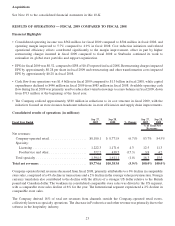
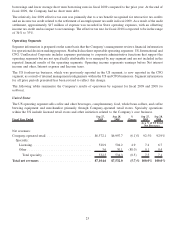
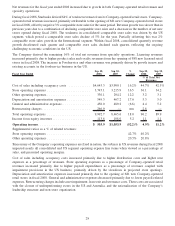
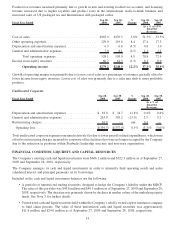
Company-operated retail revenues increased primarily due to the opening of 445 new Company-operated retail
stores in fiscal 2008, partially offset by a 5% decrease in comparable store sales for fiscal 2008. The US Company-
operated retail business continued to experience deteriorating trends in transactions during the year, driven by the
US economic slowdown. Licensing revenues increased primarily due to higher product sales and royalty revenues
as a result of opening 438 new licensed retail stores in fiscal 2008.
Fiscal Year Ended Sep 28,
2008 Sep 30,
2007 %
Change Sep 28,
2008 Sep 30,
2007
As a % of US Total
Net Revenues
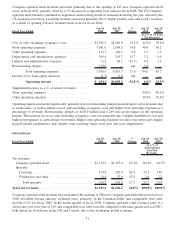
Cost of sales including occupancy costs .............. $3,206.3 $2,804.0 14.3% 42.6% 39.9%
Store operating expenses ......................... 3,081.0 2,684.2 14.8 40.9 38.2
Other operating expenses ......................... 111.7 104.5 6.9 1.5 1.5
Depreciation and amortization expenses .............. 395.4 341.7 15.7 5.2 4.9
General and administrative expenses ................ 71.2 84.1 (15.3) 0.9 1.2
Restructuring charges............................ 210.9 — nm 2.8 —
Total operating expenses .................. 7,076.5 6,018.5 17.6 94.0 85.7
Income (loss) from equity investees ................. (1.3) 0.8 nm — —
Operating income ...................... $ 454.2 $1,005.2 (54.8)% 6.0% 14.3%
Supplemental ratios as a % of related revenues:
Store operating expenses ......................... 44.0% 40.9%
Other operating expenses ......................... 20.9% 22.6%
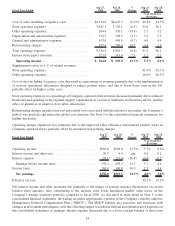
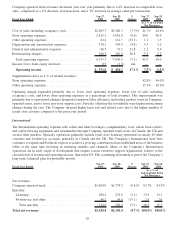
Operating margin contracted significantly primarily due to restructuring charges incurred and to softer revenues due
to weak traffic, as well as higher cost of sales including occupancy costs and higher store operating expenses as a
percentage of revenues. Restructuring charges of $210.9 million had a 280 basis point impact on the operating
margin. The increase in cost of sales including occupancy costs was primarily due to higher distribution costs and
higher rent expenses as a percentage of revenues. Higher store operating expenses wasdue to the softer sales, higher
payroll-related expenditures, and charges from canceling future store sites and asset impairments.
International
Fiscal Year Ended Sep 28,
2008 Sep 30,
2007 %
Change Sep 28,
2008 Sep 30,
2007
As a % of
International
Total Net
Revenues
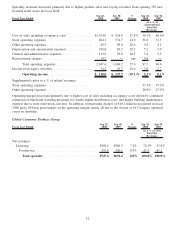
Net revenues:
Company-operated retail ....................... $1,774.2 $1,437.4 23.4% 84.3% 84.7%
Specialty:
Licensing ................................. 274.8 220.9 24.4 13.1 13.0
Foodservice and other ....................... 54.4 37.9 43.5 2.6 2.2
Total specialty ........................... 329.2 258.8 27.2 15.7 15.3
Total net revenues ............................. $2,103.4 $1,696.2 24.0% 100.0% 100.0%
Company-operated retail revenues increased due to the opening of 236 new Company-operated retail stores in fiscal
2008, favorable foreign currency exchange rates, primarily on the Canadian dollar, and comparable store sales
growth of 2% for fiscal 2008. In the fourth quarter of fiscal 2008, Company-operated retail revenues grew at a
slower rate year-over-year of 12% and comparable store sales were flat compared to the same quarter in fiscal 2007,
both driven by slowdowns in the UK and Canada, due to the weakening global economy.
31