Starbucks 2009 Annual Report Download - page 85
Download and view the complete annual report
Please find page 85 of the 2009 Starbucks annual report below. You can navigate through the pages in the report by either clicking on the pages listed below, or by using the keyword search tool below to find specific information within the annual report.-
 1
1 -
2
-
3
-
4
-
5
-
6
-
7
-
8
-
9
-
10
-
11
-
12
-
13
-
14
-
15
-
16
-
17
-
18
-
19
-
20
-
21
-
22
-
23
-
24
-
25
-
26
-
27
-
28
-
29
-
30
-
31
-
32
-
33
-
34
-
35
-
36
-
37
-
38
-
39
-
40
-
41
-
42
-
43
-
44
-
45
-
46
-
47
-
48
-
49
-
50
-
51
-
52
-
53
-
54
-
55
-
56
-
57
-
58
-
59
-
60
-
61
-
62
-
63
-
64
-
65
-
66
-
67
-
68
-
69
-
70
-
71
-
72
-
73
-
74
-
 75
75 -
 76
76 -
 77
77 -
 78
78 -
 79
79 -
 80
80 -
 81
81 -
 82
82 -
 83
83 -
 84
84 -
 85
85 -
 86
86 -
 87
87 -
 88
88 -
 89
89 -
 90
90 -
 91
91 -
 92
92 -
 93
93 -
 94
94 -
 95
95 -
96
-
97
-
98
 |
 |

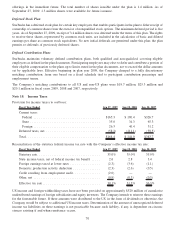
Note 19: Subsequent Event
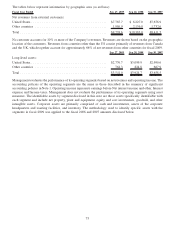
On September 30, 2009, Starbucks acquired 100 percent ownership of the Company’s business in France,
converting it from a 50% joint venture with Sigla S.A. (Grupo Vips) of Spain to a Company-operated market.
Starbucks simultaneously sold its 50% ownership interests in the Spain and Portugal markets to Grupo Vips,
converting them to licensed markets.
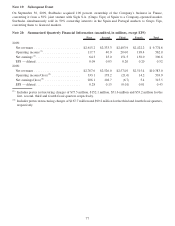
Note 20: Summarized Quarterly Financial Information (unaudited, in millions, except EPS)
First Second Third Fourth Total
2009:
Net revenues .......................... $2,615.2 $2,333.3 $2,403.9 $2,422.2 $ 9,774.6
Operating income
(1)
..................... 117.7 40.9 204.0 199.4 562.0
Net earnings
(1)
......................... 64.3 25.0 151.5 150.0 390.8
EPS — diluted......................... 0.09 0.03 0.20 0.20 0.52
2008:
Net revenues .......................... $2,767.6 $2,526.0 $2,574.0 $2,515.4 $10,383.0
Operating income/(loss)
(2)
................ 333.1 178.2 (21.6) 14.2 503.9
Net earnings/(loss)
(2)
.................... 208.1 108.7 (6.7) 5.4 315.5
EPS — diluted......................... 0.28 0.15 (0.01) 0.01 0.43
(1)
Includes pretax restructuring charges of $75.5 million, $152.1 million, $51.6 million and $53.2 million for the
first, second, third and fourth fiscal quarters respectively.
(2)
Includes pretax restructuring charges of $167.7 million and $99.2 million for the third and fourth fiscal quarters,
respectively.
77