Starbucks 2009 Annual Report Download - page 27
Download and view the complete annual report
Please find page 27 of the 2009 Starbucks annual report below. You can navigate through the pages in the report by either clicking on the pages listed below, or by using the keyword search tool below to find specific information within the annual report.-
 1
1 -
2
-
3
-
4
-
5
-
6
-
7
-
8
-
9
-
10
-
11
-
12
-
13
-
14
-
15
-
16
-
 17
17 -
 18
18 -
 19
19 -
 20
20 -
 21
21 -
 22
22 -
 23
23 -
 24
24 -
 25
25 -
 26
26 -
 27
27 -
 28
28 -
 29
29 -
 30
30 -
 31
31 -
 32
32 -
 33
33 -
 34
34 -
 35
35 -
 36
36 -
 37
37 -
38
-
39
-
40
-
41
-
42
-
43
-
44
-
45
-
46
-
47
-
48
-
49
-
50
-
51
-
52
-
53
-
54
-
55
-
56
-
57
-
58
-
59
-
60
-
61
-
62
-
63
-
64
-
65
-
66
-
67
-
68
-
69
-
70
-
71
-
72
-
73
-
74
-
75
-
76
-
77
-
78
-
79
-
80
-
81
-
82
-
83
-
84
-
85
-
86
-
87
-
88
-
89
-
90
-
91
-
92
-
93
-
94
-
95
-
96
-
97
-
98
 |
 |

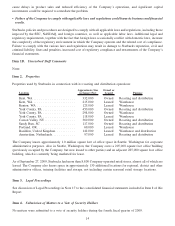
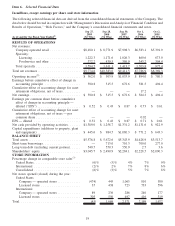
Item 6. Selected Financial Data
In millions, except earnings per share and store information
The following selected financial data are derived from the consolidated financial statements of the Company. The
data below should be read in conjunction with “Management’s Discussion and Analysis of Financial Condition and
Results of Operations,” “Risk Factors,” and the Company’s consolidated financial statements and notes.
As of and for the Fiscal Year Ended
(1)
Sep 27,
2009
(52 Wks)
Sep 28,
2008
(52 Wks)
Sep 30,
2007
(52 Wks)
Oct 1,
2006
(52 Wks)
Oct 2,
2005
(52 Wks)
RESULTS OF OPERATIONS
Net revenues:
Company-operated retail ................. $8,180.1 $ 8,771.9 $7,998.3 $6,583.1 $5,391.9
Specialty:
Licensing........................... 1,222.3 1,171.6 1,026.3 860.6 673.0
Foodservice and other ................. 372.2 439.5 386.9 343.2 304.4
Total specialty ......................... 1,594.5 1,611.1 1,413.2 1,203.8 977.4
Total net revenues ........................ $9.774.6 $10,383.0 $9,411.5 $7,786.9 $6,369.3
Operating income
(2)
....................... $ 562.0 $ 503.9 $1,053.9 $ 894.0 $ 780.5
Earnings before cumulative effect of change in
accounting principle .................... 390.8 315.5 672.6 581.5 494.4
Cumulative effect of accounting change for asset
retirement obligations, net of taxes.......... — — — 17.2 —
Net earnings ............................ $ 390.8 $ 315.5 $ 672.6 $ 564.3 $ 494.4
Earnings per common share before cumulative
effect of change in accounting principle —
diluted (“EPS”) ........................ $ 0.52 $ 0.43 $ 0.87 $ 0.73 $ 0.61
Cumulative effect of accounting change for asset
retirement obligations, net of taxes — per
common share ......................... — — — 0.02 —
EPS — diluted .......................... $ 0.52 $ 0.43 $ 0.87 $ 0.71 $ 0.61
Net cash provided by operating activities ....... $1,389.0 $ 1,258.7 $1,331.2 $1,131.6 $ 922.9
Capital expenditures (additions to property, plant
and equipment) ........................ $ 445.6 $ 984.5 $1,080.3 $ 771.2 $ 643.3
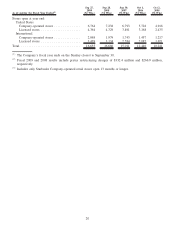
BALANCE SHEET
Total assets ............................. $5,576.8 $ 5,672.6 $5,343.9 $4,428.9 $3,513.7
Short-term borrowings. .................... — 713.0 710.3 700.0 277.0
Long-term debt (including current portion)...... 549.5 550.3 550.9 2.7 3.6
Shareholders’ equity . . .................... $3,045.7 $ 2,490.9 $2,284.1 $2,228.5 $2,090.3
STORE INFORMATION
Percentage change in comparable store sales
(3)
United States.......................... (6)% (5)% 4% 7% 9%
International .......................... (2)% 2% 7% 8% 6%
Consolidated .......................... (6)% (3)% 5% 7% 8%
Net stores opened (closed) during the year:
United States
Company — operated stores ............. (474) 445 1,065 810 580
Licensed stores . . .................... 35 438 723 733 596
International
Company — operated stores ............. 89 236 286 240 177
Licensed stores . . .................... 305 550 497 416 319
Total.................................. (45) 1,669 2,571 2,199 1,672
19