Starbucks 2009 Annual Report Download - page 26
Download and view the complete annual report
Please find page 26 of the 2009 Starbucks annual report below. You can navigate through the pages in the report by either clicking on the pages listed below, or by using the keyword search tool below to find specific information within the annual report.-
 1
1 -
2
-
3
-
4
-
5
-
6
-
7
-
8
-
9
-
10
-
11
-
12
-
13
-
14
-
15
-
 16
16 -
 17
17 -
 18
18 -
 19
19 -
 20
20 -
 21
21 -
 22
22 -
 23
23 -
 24
24 -
 25
25 -
 26
26 -
 27
27 -
 28
28 -
 29
29 -
 30
30 -
 31
31 -
 32
32 -
 33
33 -
 34
34 -
 35
35 -
 36
36 -
37
-
38
-
39
-
40
-
41
-
42
-
43
-
44
-
45
-
46
-
47
-
48
-
49
-
50
-
51
-
52
-
53
-
54
-
55
-
56
-
57
-
58
-
59
-
60
-
61
-
62
-
63
-
64
-
65
-
66
-
67
-
68
-
69
-
70
-
71
-
72
-
73
-
74
-
75
-
76
-
77
-
78
-
79
-
80
-
81
-
82
-
83
-
84
-
85
-
86
-
87
-
88
-
89
-
90
-
91
-
92
-
93
-
94
-
95
-
96
-
97
-
98
 |
 |
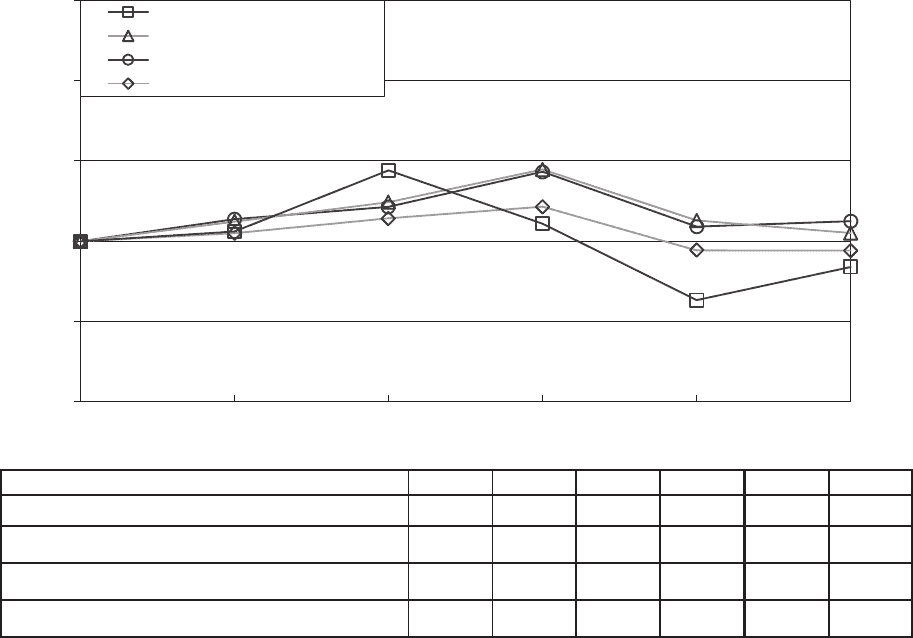
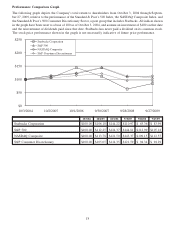
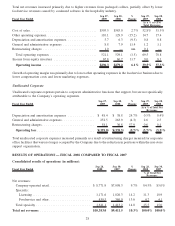
Performance Comparison Graph
The following graph depicts the Company’s total return to shareholders from October 3, 2004 through Septem-
ber 27, 2009, relative to the performance of the Standard & Poor’s 500 Index, the NASDAQ Composite Index, and
the Standard & Poor’s 500 Consumer Discretionary Sector, a peer group that includes Starbucks. All indices shown
in the graph have been reset to a base of 100 as of October 3, 2004, and assume an investment of $100 on that date
and the reinvestment of dividends paid since that date. Starbucks has never paid a dividend on its common stock.
The stock price performance shown in the graph is not necessarily indicative of future price performance.
$0
$50
$100
$150
$200
$250
10/3/2004 10/2/2005 10/1/2006 9/30/2007 9/28/2008 9/27/2009
Starbucks Corporation
S&P 500
NASDAQ Composite
S&P Consumer Discretionary
10/3/04 10/2/05 10/1/06 9/30/07 9/28/08 9/27/09
Starbucks Corporation $100.00 $106.10 $144.22 $110.97 $ 63.36 $ 83.99
S&P 500 $100.00 $112.25 $124.37 $144.81 $112.99 $105.18
NASDAQ Composite $100.00 $113.78 $121.50 $143.37 $109.15 $112.55
S&P Consumer Discretionary $100.00 $105.05 $114.35 $121.59 $ 94.34 $ 94.29
18