Starbucks 2009 Annual Report Download - page 61
Download and view the complete annual report
Please find page 61 of the 2009 Starbucks annual report below. You can navigate through the pages in the report by either clicking on the pages listed below, or by using the keyword search tool below to find specific information within the annual report.-
 1
1 -
2
-
3
-
4
-
5
-
6
-
7
-
8
-
9
-
10
-
11
-
12
-
13
-
14
-
15
-
16
-
17
-
18
-
19
-
20
-
21
-
22
-
23
-
24
-
25
-
26
-
27
-
28
-
29
-
30
-
31
-
32
-
33
-
34
-
35
-
36
-
37
-
38
-
39
-
40
-
41
-
42
-
43
-
44
-
45
-
46
-
47
-
48
-
49
-
50
-
 51
51 -
 52
52 -
 53
53 -
 54
54 -
 55
55 -
 56
56 -
 57
57 -
 58
58 -
 59
59 -
 60
60 -
 61
61 -
 62
62 -
 63
63 -
 64
64 -
 65
65 -
 66
66 -
 67
67 -
 68
68 -
 69
69 -
 70
70 -
 71
71 -
72
-
73
-
74
-
75
-
76
-
77
-
78
-
79
-
80
-
81
-
82
-
83
-
84
-
85
-
86
-
87
-
88
-
89
-
90
-
91
-
92
-
93
-
94
-
95
-
96
-
97
-
98
 |
 |

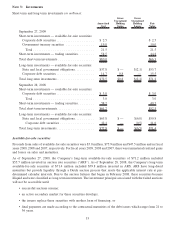
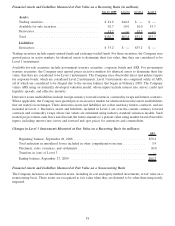
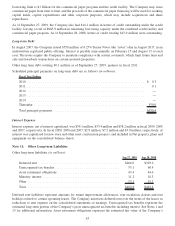
Note 3: Investments
Short-term and long-term investments (in millions):
Amortized
Cost
Gross
Unrealized
Holding
Gains
Gross
Unrealized
Holding
Losses Fair
Value
September 27, 2009
Short-term investments — available-for-sale securities:
Corporate debt securities ..................... $ 2.5 $ 2.5
Government treasury securities ................ 19.0 19.0
Total .................................. 21.5 21.5
Short-term investments — trading securities ......... 58.5 44.8
Total short-term investments .................... $80.0 $66.3
Long-term investments — available-for-sale securities:
State and local government obligations........... $57.8 $ — $(2.1) $55.7
Corporate debt securities ..................... 14.7 0.8 — 15.5
Total long-term investments..................... $72.5 $0.8 $(2.1) $71.2
September 28, 2008
Short-term investments — available-for-sale securities:
Corporate debt securities ..................... $ 3.0 $ 3.0
Total .................................. 3.0 3.0
Short-term investments — trading securities ......... 58.2 49.5
Total short-term investments .................... $61.2 $52.5
Long-term investments — available-for-sale securities:
State and local government obligations........... $65.8 $ — $(6.0) $59.8
Corporate debt securities ................... 12.1 — (0.5) 11.6
Total long-term investments..................... $77.9 $ — $(6.5) $71.4
Available-for-sale securities
Proceeds from sales of available-for-sale securities were $5.0 million, $75.9 million and $47.5 million and in fiscal
years 2009, 2008 and 2007, respectively. For fiscal years 2009, 2008 and 2007, therewere immaterial realized gains
and losses on sales and maturities.
As of September 27, 2009, the Company’s long-term available-for-sale securities of $71.2 million included
$55.7 million invested in auction rate securities (“ARS”). As of September 28, 2008, the Company’s long-term
available-for-sale securities of $71.4 million included $59.8 million invested in ARS. ARS have long-dated
maturities but provide liquidity through a Dutch auction process that resets the applicable interest rate at pre-
determined calendar intervals. Due to the auction failures that began in February 2008, these securities became
illiquid and were classified as long-term investments. The investment principal associated with the failed auctions
will not be accessible until:
• successful auctions resume;
• an active secondary market for these securities develops;
• the issuers replace these securities with another form of financing; or
• final payments are made according to the contractual maturities of the debt issues which range from 21 to
36 years.
53