Starbucks 2009 Annual Report Download - page 35
Download and view the complete annual report
Please find page 35 of the 2009 Starbucks annual report below. You can navigate through the pages in the report by either clicking on the pages listed below, or by using the keyword search tool below to find specific information within the annual report.-
 1
1 -
2
-
3
-
4
-
5
-
6
-
7
-
8
-
9
-
10
-
11
-
12
-
13
-
14
-
15
-
16
-
17
-
18
-
19
-
20
-
21
-
22
-
23
-
24
-
 25
25 -
 26
26 -
 27
27 -
 28
28 -
 29
29 -
 30
30 -
 31
31 -
 32
32 -
 33
33 -
 34
34 -
 35
35 -
 36
36 -
 37
37 -
 38
38 -
 39
39 -
 40
40 -
 41
41 -
 42
42 -
 43
43 -
 44
44 -
 45
45 -
46
-
47
-
48
-
49
-
50
-
51
-
52
-
53
-
54
-
55
-
56
-
57
-
58
-
59
-
60
-
61
-
62
-
63
-
64
-
65
-
66
-
67
-
68
-
69
-
70
-
71
-
72
-
73
-
74
-
75
-
76
-
77
-
78
-
79
-
80
-
81
-
82
-
83
-
84
-
85
-
86
-
87
-
88
-
89
-
90
-
91
-
92
-
93
-
94
-
95
-
96
-
97
-
98
 |
 |

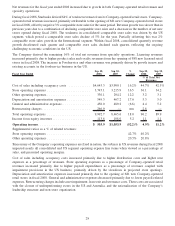
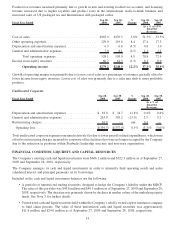
Company-operated retail revenues decreased primarily due to unfavorable foreign currency exchange rates,
particularly for the British pound and Canadian dollar. Partially offsetting the decrease were the net new store
openings of 89 Company-operated stores.
Specialty revenues decreased primarily due to continued softness in the hospitality industry and unfavorable foreign
currency exchange rates.
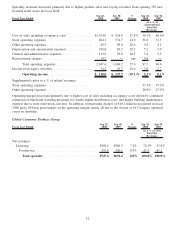
Fiscal Year Ended Sep 27,
2009 Sep 28,
2008 %
Change Sep 27,
2009 Sep 28,
2008
As a % of
International Total
Net Revenues
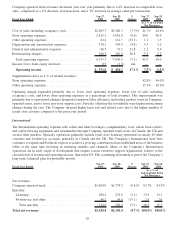
Cost of sales including occupancy costs .............. $ 963.7 $1,054.0 (8.6)% 50.2% 50.1%
Store operating expenses ......................... 610.0 664.1 (8.1) 31.8 31.6
Other operating expenses ......................... 72.9 88.5 (17.6) 3.8 4.2
Depreciation and amortization expenses .............. 102.5 108.8 (5.8) 5.3 5.2
General and administrative expenses ................ 105.0 113.0 (7.1) 5.5 5.4
Restructuring charges............................ 27.0 19.2 40.6 1.4 0.9
Total operating expenses ....................... 1,881.1 2,047.6 (8.1) 98.0 97.3
Income from equity investees...................... 53.6 54.2 (1.1) 2.8 2.6
Operating income............................ $ 92.9 $ 110.0 (15.5)% 4.8% 5.2%
Supplemental ratios as a % of related revenues:
Store operating expenses ......................... 37.9% 37.4%
Other operating expenses ......................... 23.3% 26.9%
Operating margin decreased primarily due to higher restructuring charges and higher store operating expenses as a
percentage of total revenues. Restructuring charges of $27.0 million recognized during the year had a 50 basis point
impact on operating margin compared to the prior year, due to the previously announced store closures. Higher store
operating expenses as of percentage of Company-operated retail revenues were driven by an increase in store
impairment charges and a decline in sales leverage impacting salaries and benefits. Partially offsetting the decrease
in operating margin were lower other operating expenses due to headcount reductions in the non-store support
functions.
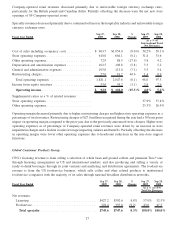
Global Consumer Products Group
CPG’s licensing revenue is from selling a selection of whole bean and ground coffees and premium Tazo»teas
through licensing arrangements in US and international markets, and also producing and selling a variety of
ready-to-drink beverages through its joint ventures and marketing and distribution agreements. The foodservice
revenue is from the US foodservice business, which sells coffee and other related products to institutional
foodservice companies with the majority of its sales through national broadline distribution networks.
Fiscal Year Ended Sep 27,
2009 Sep 28,
2008 %
Change Sep 27,
2009 Sep 28,
2008
As a % of CPG
Total Net Revenues
Net revenues:
Licensing . . . .................................. $427.2 $392.6 8.8% 57.0% 52.5%
Foodservice. . .................................. 322.4 355.0 (9.2) 43.0 47.5
Total specialty ............................... $749.6 $747.6 0.3% 100.0% 100.0%
27