Starbucks 2009 Annual Report Download - page 33
Download and view the complete annual report
Please find page 33 of the 2009 Starbucks annual report below. You can navigate through the pages in the report by either clicking on the pages listed below, or by using the keyword search tool below to find specific information within the annual report.-
 1
1 -
2
-
3
-
4
-
5
-
6
-
7
-
8
-
9
-
10
-
11
-
12
-
13
-
14
-
15
-
16
-
17
-
18
-
19
-
20
-
21
-
22
-
 23
23 -
 24
24 -
 25
25 -
 26
26 -
 27
27 -
 28
28 -
 29
29 -
 30
30 -
 31
31 -
 32
32 -
 33
33 -
 34
34 -
 35
35 -
 36
36 -
 37
37 -
 38
38 -
 39
39 -
 40
40 -
 41
41 -
 42
42 -
 43
43 -
44
-
45
-
46
-
47
-
48
-
49
-
50
-
51
-
52
-
53
-
54
-
55
-
56
-
57
-
58
-
59
-
60
-
61
-
62
-
63
-
64
-
65
-
66
-
67
-
68
-
69
-
70
-
71
-
72
-
73
-
74
-
75
-
76
-
77
-
78
-
79
-
80
-
81
-
82
-
83
-
84
-
85
-
86
-
87
-
88
-
89
-
90
-
91
-
92
-
93
-
94
-
95
-
96
-
97
-
98
 |
 |

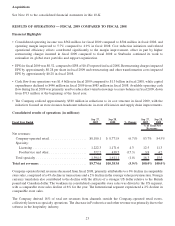
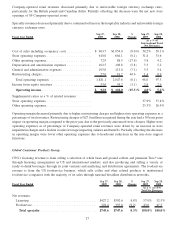
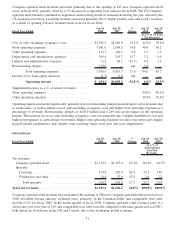
borrowings and lower average short term borrowing rates in fiscal 2009 compared to the prior year. At the end of
fiscal 2009, the Company had no short term debt.
The relatively low 2009 effective tax rate was primarily due to a tax benefit recognized for retroactive tax credits
and an income tax credit related to the settlement of an employment tax audit in fiscal 2009. As a result of the audit
settlement, approximately $17 million of expense was recorded in Store operating expenses, with an offsetting
income tax credit and no impact to net earnings. The effective tax rate for fiscal 2010 is expected to be in the range
of 34% to 35%.
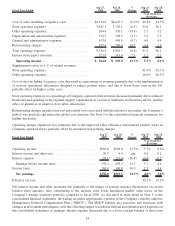
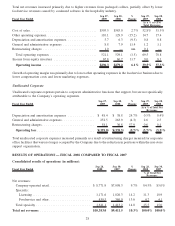
Operating Segments
Segment information is prepared on the same basis that the Company’s management reviews financial information
for operational decision making purposes. Starbucks has three reportable operating segments: US, International and
CPG. Unallocated Corporate includes expenses pertaining to corporate administrative functions that support the
operating segments but are not specifically attributable to or managed by any segment and are not included in the
reported financial results of the operating segments. Operating income represents earnings before Net interest
income and other, Interest expense and Income taxes.
The US foodservice business, which was previously reported in the US segment, is now reported in the CPG
segment, as a result of internal management realignments within the US and CPG businesses. Segment information
for all prior periods presented has been revised to reflect this change.
The following tables summarize the Company’s results of operations by segment for fiscal 2009 and 2008 (in
millions).
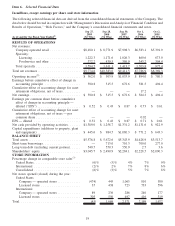
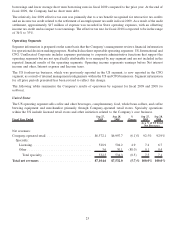
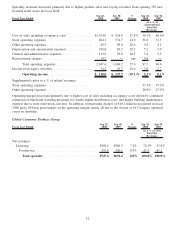
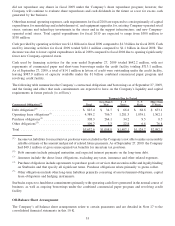
United States
The US operating segment sells coffee and other beverages, complementary food, whole bean coffees, and coffee
brewing equipment and merchandise primarily through Company-operated retail stores. Specialty operations
within the US include licensed retail stores and other initiatives related to the Company’s core business.
Fiscal Year Ended Sep 27,
2009 Sep 28,
2008 %
Change Sep 27,
2009 Sep 28,
2008
As a % of US Total
Net Revenues
Net revenues:
Company-operated retail ......................... $6,572.1 $6,997.7 (6.1)% 92.5% 92.9%
Specialty:
Licensing ................................. 528.9 504.2 4.9 7.4 6.7
Other .................................... 3.6 30.1 (88.0) 0.1 0.4
Total specialty ........................... 532.5 534.3 (0.3) 7.5 7.1
Total net revenues ............................. $7,104.6 $7,532.0 (5.7)% 100.0% 100.0%
25