Starbucks 2009 Annual Report Download - page 82
Download and view the complete annual report
Please find page 82 of the 2009 Starbucks annual report below. You can navigate through the pages in the report by either clicking on the pages listed below, or by using the keyword search tool below to find specific information within the annual report.-
 1
1 -
2
-
3
-
4
-
5
-
6
-
7
-
8
-
9
-
10
-
11
-
12
-
13
-
14
-
15
-
16
-
17
-
18
-
19
-
20
-
21
-
22
-
23
-
24
-
25
-
26
-
27
-
28
-
29
-
30
-
31
-
32
-
33
-
34
-
35
-
36
-
37
-
38
-
39
-
40
-
41
-
42
-
43
-
44
-
45
-
46
-
47
-
48
-
49
-
50
-
51
-
52
-
53
-
54
-
55
-
56
-
57
-
58
-
59
-
60
-
61
-
62
-
63
-
64
-
65
-
66
-
67
-
68
-
69
-
70
-
71
-
 72
72 -
 73
73 -
 74
74 -
 75
75 -
 76
76 -
 77
77 -
 78
78 -
 79
79 -
 80
80 -
 81
81 -
 82
82 -
 83
83 -
 84
84 -
 85
85 -
 86
86 -
 87
87 -
 88
88 -
 89
89 -
 90
90 -
 91
91 -
 92
92 -
93
-
94
-
95
-
96
-
97
-
98
 |
 |

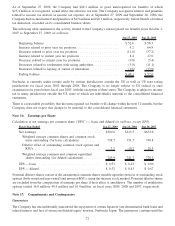
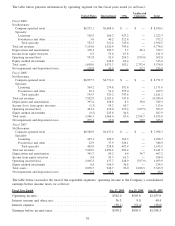
result of internal management realignments within the US and CPG businesses. Segment information for all prior
periods presented has been revised to reflect this change.
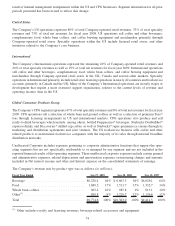
United States
The Company’s US operations represent 80% of total Company-operated retail revenues, 33% of total specialty
revenues and 73% of total net revenues for fiscal year 2009. US operations sell coffee and other beverages,
complementary food, whole bean coffees, and coffee brewing equipment and merchandise primarily through
Company-operated retail stores. Specialty operations within the US include licensed retail stores, and other
initiatives related to the Company’s core business.
International
The Company’s International operations represent the remaining 20% of Company-operated retail revenues and
20% of total specialty revenues as well as 19% of total net revenues for fiscal year 2009. International operations
sell coffee and other beverages, complementary food, whole bean coffees, and coffee brewing equipment and
merchandise through Company-operated retail stores in the UK, Canada and several other markets. Specialty
operations in International primarily include retail store licensing operations in nearly 40 countries and foodservice
accounts, primarily in Canada and the UK. Many of the Company’s International operations are in early stages of
development that require a more extensive support organization, relative to the current levels of revenue and
operating income, than in the US.
Global Consumer Products Group
The Company’s CPG segment represents 47% of total specialty revenues and 8% of total net revenues for fiscal year
2009. CPG operations sell a selection of whole bean and ground coffees as well as a selection of premium Tazo»
teas through licensing arrangements in US and international markets. CPG operations also produce and sell
ready-to-drink beverages which include, among others, bottled Frappuccino»beverages, Starbucks DoubleShot»
espresso drinks, and Discoveries»chilled cup coffee, as well as Starbucks»super-premium ice creams through its
marketing and distribution agreements and joint ventures. The US foodservice business sells coffee and other
related products to institutional foodservice companies with the majority of its sales through national broadline
distribution networks.
Unallocated Corporate includes expenses pertaining to corporate administrative functions that support the oper-
ating segments but are not specifically attributable to or managed by any segment and are not included in the
reported financial results of the operating segments. These unallocated corporate expenses include certain general
and administrative expenses, related depreciation and amortization expenses, restructuring charges and amounts
included in Net interest income and other and Interest expense on the consolidated statements of earnings.
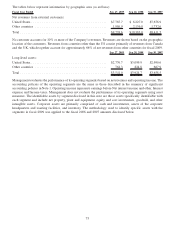
The Company’s revenue mix by product type was as follows (in millions):
Fiscal Year Ended Sep 27, 2009 Sep 28, 2008 Sep 30, 2007
Beverage ................................ $6,238.4 64% $ 6,663.3 64% $6,029.1 64%
Food.................................... 1,680.2 17% 1,511.7 15% 1,332.7 14%
Whole bean coffees......................... 965.2 10% 987.8 9% 913.1 10%
Other
(1)
................................. 890.8 9% 1,220.2 12% 1,136.6 12%
Total ................................... $9,774.6 100% $10,383.0 100% $9,411.5 100%
(1)
Other includes royalty and licensing revenues, beverage-related accessories and equipment.
74