Starbucks 2009 Annual Report Download - page 50
Download and view the complete annual report
Please find page 50 of the 2009 Starbucks annual report below. You can navigate through the pages in the report by either clicking on the pages listed below, or by using the keyword search tool below to find specific information within the annual report.-
 1
1 -
2
-
3
-
4
-
5
-
6
-
7
-
8
-
9
-
10
-
11
-
12
-
13
-
14
-
15
-
16
-
17
-
18
-
19
-
20
-
21
-
22
-
23
-
24
-
25
-
26
-
27
-
28
-
29
-
30
-
31
-
32
-
33
-
34
-
35
-
36
-
37
-
38
-
39
-
 40
40 -
 41
41 -
 42
42 -
 43
43 -
 44
44 -
 45
45 -
 46
46 -
 47
47 -
 48
48 -
 49
49 -
 50
50 -
 51
51 -
 52
52 -
 53
53 -
 54
54 -
 55
55 -
 56
56 -
 57
57 -
 58
58 -
 59
59 -
 60
60 -
61
-
62
-
63
-
64
-
65
-
66
-
67
-
68
-
69
-
70
-
71
-
72
-
73
-
74
-
75
-
76
-
77
-
78
-
79
-
80
-
81
-
82
-
83
-
84
-
85
-
86
-
87
-
88
-
89
-
90
-
91
-
92
-
93
-
94
-
95
-
96
-
97
-
98
 |
 |

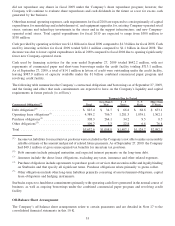
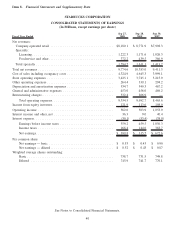
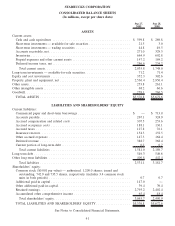
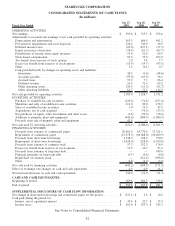
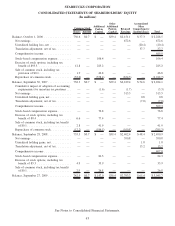
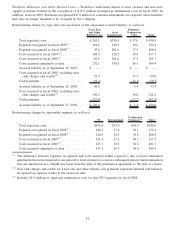
STARBUCKS CORPORATION
CONSOLIDATED STATEMENTS OF CASH FLOWS
(In millions)
Fiscal Year Ended Sep 27,
2009 Sep 28,
2008 Sep 30,
2007
OPERATING ACTIVITIES:
Net earnings . . . . . . . . . . . . . . . . . . . . . . . . . . . . . . . . . . . . . . . . . . . . . . . . . . . . $ 390.8 $ 315.5 $ 672.6
Adjustments to reconcile net earnings to net cash provided by operating activities:
Depreciation and amortization . . . . . . . . . . . . . . . . . . . . . . . . . . . . . . . . . . . . . . 563.3 604.5 491.2
Provision for impairments and asset disposals . . . . . . . . . . . . . . . . . . . . . . . . . . . 224.4 325.0 26.0
Deferred income taxes . . . . . . . . . . . . . . . . . . . . . . . . . . . . . . . . . . . . . . . . . . . (69.6) (117.1) (37.3)
Equity in income of investees . . . . . . . . . . . . . . . . . . . . . . . . . . . . . . . . . . . . . . (78.4) (61.3) (65.7)
Distributions of income from equity investees . . . . . . . . . . . . . . . . . . . . . . . . . . . 53.0 52.6 65.9
Stock-based compensation . . . . . . . . . . . . . . . . . . . . . . . . . . . . . . . . . . . . . . . . 83.2 75.0 103.9
Tax benefit from exercise of stock options . . . . . . . . . . . . . . . . . . . . . . . . . . . . . 2.0 3.8 7.7
Excess tax benefit from exercise of stock options . . . . . . . . . . . . . . . . . . . . . . . . (15.9) (14.7) (93.1)
Other . . . . . . . . . . . . . . . . . . . . . . . . . . . . . . . . . . . . . . . . . . . . . . . . . . . . . . . 5.4 (0.1) 0.7
Cash provided/(used) by changes in operating assets and liabilities:
Inventories. . . . . . . . . . . . . . . . . . . . . . . . . . . . . . . . . . . . . . . . . . . . . . . . . . 28.5 (0.6) (48.6)
Accounts payable . . . . . . . . . . . . . . . . . . . . . . . . . . . . . . . . . . . . . . . . . . . . . (53.0) (63.9) 36.1
Accrued taxes . . . . . . . . . . . . . . . . . . . . . . . . . . . . . . . . . . . . . . . . . . . . . . . 57.2 7.3 86.4
Deferred revenue . . . . . . . . . . . . . . . . . . . . . . . . . . . . . . . . . . . . . . . . . . . . . 16.3 72.4 63.2
Other operating assets . . . . . . . . . . . . . . . . . . . . . . . . . . . . . . . . . . . . . . . . . . 120.5 (11.2) (92.7)
Other operating liabilities . . . . . . . . . . . . . . . . . . . . . . . . . . . . . . . . . . . . . . . 61.3 71.5 114.9
Net cash provided by operating activities . . . . . . . . . . . . . . . . . . . . . . . . . . . . . . . . 1,389.0 1,258.7 1,331.2
INVESTING ACTIVITIES:
Purchase of available-for-sale securities . . . . . . . . . . . . . . . . . . . . . . . . . . . . . . . (129.2) (71.8) (237.4)
Maturities and calls of available-for-sale securities. . . . . . . . . . . . . . . . . . . . . . . . 111.0 20.0 178.2
Sales of available-for-sale securities . . . . . . . . . . . . . . . . . . . . . . . . . . . . . . . . . . 5.0 75.9 47.5
Acquisitions, net of cash acquired . . . . . . . . . . . . . . . . . . . . . . . . . . . . . . . . . . . — (74.2) (53.3)
Net purchases of equity, other investments and other assets. . . . . . . . . . . . . . . . . . (4.8) (52.0) (56.6)
Additions to property, plant and equipment . . . . . . . . . . . . . . . . . . . . . . . . . . . . . (445.6) (984.5) (1,080.3)
Proceeds from sale of property, plant and equipment . . . . . . . . . . . . . . . . . . . . . . 42.5 — —
Net cash used by investing activities . . . . . . . . . . . . . . . . . . . . . . . . . . . . . . . . . . . (421.1) (1,086.6) (1,201.9)
FINANCING ACTIVITIES:
Proceeds from issuance of commercial paper . . . . . . . . . . . . . . . . . . . . . . . . . . . 20,965.4 65,770.8 17,311.1
Repayments of commercial paper . . . . . . . . . . . . . . . . . . . . . . . . . . . . . . . . . . . (21,378.5) (66,068.0) (16,600.9)
Proceeds from short-term borrowings . . . . . . . . . . . . . . . . . . . . . . . . . . . . . . . . . 1,338.0 528.2 770.0
Repayments of short-term borrowings . . . . . . . . . . . . . . . . . . . . . . . . . . . . . . . . (1,638.0) (228.8) (1,470.0)
Proceeds from issuance of common stock . . . . . . . . . . . . . . . . . . . . . . . . . . . . . . 57.3 112.3 176.9
Excess tax benefit from exercise of stock options . . . . . . . . . . . . . . . . . . . . . . . . 15.9 14.7 93.1
Proceeds from issuance of long-term debt . . . . . . . . . . . . . . . . . . . . . . . . . . . . . . — — 549.0
Principal payments on long-term debt. . . . . . . . . . . . . . . . . . . . . . . . . . . . . . . . . (0.7) (0.6) (0.8)
Repurchase of common stock . . . . . . . . . . . . . . . . . . . . . . . . . . . . . . . . . . . . . . — (311.4) (996.8)
Other . . . . . . . . . . . . . . . . . . . . . . . . . . . . . . . . . . . . . . . . . . . . . . . . . . . . . . . (1.6) (1.7) (3.5)
Net cash used by financing activities . . . . . . . . . . . . . . . . . . . . . . . . . . . . . . . . . . . (642.2) (184.5) (171.9)
Effect of exchange rate changes on cash and cash equivalents . . . . . . . . . . . . . . . . . 4.3 0.9 11.3
Net increase/(decrease) in cash and cash equivalents . . . . . . . . . . . . . . . . . . . . . . . . 330.0 (11.5) (31.3)
CASH AND CASH EQUIVALENTS:
Beginning of period. . . . . . . . . . . . . . . . . . . . . . . . . . . . . . . . . . . . . . . . . . . . . . . 269.8 281.3 312.6
End of period . . . . . . . . . . . . . . . . . . . . . . . . . . . . . . . . . . . . . . . . . . . . . . . . . . . $ 599.8 $ 269.8 $ 281.3
SUPPLEMENTAL DISCLOSURE OF CASH FLOW INFORMATION:
Net change in short-term borrowings and commercial paper for the period. . . . . . . . . $ (713.1) $ 2.2 $ 10.2
Cash paid during the period for:
Interest, net of capitalized interest . . . . . . . . . . . . . . . . . . . . . . . . . . . . . . . . . . . $ 39.8 $ 52.7 $ 35.3
Income taxes . . . . . . . . . . . . . . . . . . . . . . . . . . . . . . . . . . . . . . . . . . . . . . . . . . $ 162.0 $ 259.5 $ 342.2
See Notes to Consolidated Financial Statements.
42