Starbucks 2009 Annual Report Download - page 12
Download and view the complete annual report
Please find page 12 of the 2009 Starbucks annual report below. You can navigate through the pages in the report by either clicking on the pages listed below, or by using the keyword search tool below to find specific information within the annual report.-
 1
1 -
 2
2 -
 3
3 -
 4
4 -
 5
5 -
 6
6 -
 7
7 -
 8
8 -
 9
9 -
 10
10 -
 11
11 -
 12
12 -
 13
13 -
 14
14 -
 15
15 -
 16
16 -
 17
17 -
 18
18 -
 19
19 -
 20
20 -
 21
21 -
 22
22 -
23
-
24
-
25
-
26
-
27
-
28
-
29
-
30
-
31
-
32
-
33
-
34
-
35
-
36
-
37
-
38
-
39
-
40
-
41
-
42
-
43
-
44
-
45
-
46
-
47
-
48
-
49
-
50
-
51
-
52
-
53
-
54
-
55
-
56
-
57
-
58
-
59
-
60
-
61
-
62
-
63
-
64
-
65
-
66
-
67
-
68
-
69
-
70
-
71
-
72
-
73
-
74
-
75
-
76
-
77
-
78
-
79
-
80
-
81
-
82
-
83
-
84
-
85
-
86
-
87
-
88
-
89
-
90
-
91
-
92
-
93
-
94
-
95
-
96
-
97
-
98
 |
 |

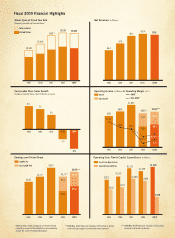
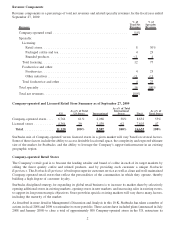
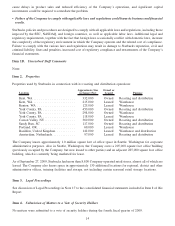
Retail sales mix by product type for Company-operated stores:
Fiscal Year Ended Sep 27, 2009 Sep 28, 2008 Sep 30, 2007
Beverages ..................................... 76% 76% 75%
Food......................................... 18% 17% 17%
Coffee-making equipment and other merchandise . . ...... 3% 4% 5%
Whole bean coffees .............................. 3% 3% 3%
Total ......................................... 100% 100% 100%
Starbucks Card
The Starbucks Card program is designed to increase customer loyalty and the frequency of store visits by
cardholders. Starbucks cards can be used in all Company-operated and most licensed stores in North America, and
in a growing number of international markets. The cards have no expiration date and do not have any inactivity fees.
Specialty Operations
Specialty operations strive to develop the Company’s brands outside the Company-operated retail store environ-
ment through a number of channels. Starbucks strategy is to reach customers where they work, travel, shop and dine
by establishing relationships with prominent third parties that share the Company’s values and commitment to
quality. These relationships take various forms, including licensing arrangements, foodservice accounts and other
initiatives related to the Company’s core businesses. In certain situations, Starbucks has an equity ownership
interest in licensee operations. During fiscal 2009, specialty revenues (which include royalties and fees from
licensees, as well as product sales derived from specialty operations) accounted for 16% of total net revenues.
Licensing — Retail stores
In its licensed retail store operations which include the Starbucks and Seattle’s Best Coffee brands, the Company
leverages the expertise of its local partners and shares the Company’s operating and store development experience.
Licensee partners provide improved, and at times the only, access to desirable retail space. Most licensees are
prominent retailers with in-depth market knowledge and access. As part of these arrangements, Starbucks receives
royalties and license fees and sells coffee, tea and related products for resale in licensed locations. Product sales to and
royalty and license fee revenues from US and International licensed retail stores accounted for 50% of specialty
revenues in fiscal 2009.Employees working in licensed retail locations are required to follow Starbucks detailed store
operating procedures and attend training classes similar to those given to employees in Company-operated stores.
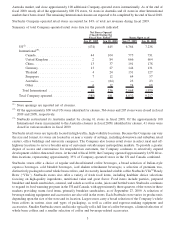
Starbucks total licensed retail stores by region and specific location at fiscal year end 2009:
Asia Pacific Europe/Middle East/Africa Americas
Japan .............. 875 Turkey ............. 123 US................ 4,364
South Korea ......... 288 United Arab Emirates . . 91 Canada ............. 262
China .............. 283 Spain .............. 76 Mexico ............. 261
Taiwan ............. 222 Greece ............. 69 Other .............. 69
Philippines .......... 160 Saudi Arabia ......... 68
Malaysia ............ 118 Kuwait ............. 62
Indonesia ........... 74 France.............. 52
New Zealand......... 42 Switzerland .......... 47
U.K. ............... 46
Other .............. 151
Total . .............. 2,062 Total ............... 785 Total ............... 4,956
During fiscal 2009, net licensed store openings included 35 in the US and 305 internationally.
4