Starbucks 2009 Annual Report Download - page 32
Download and view the complete annual report
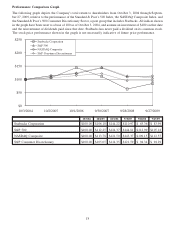
Please find page 32 of the 2009 Starbucks annual report below. You can navigate through the pages in the report by either clicking on the pages listed below, or by using the keyword search tool below to find specific information within the annual report.-
 1
1 -
2
-
3
-
4
-
5
-
6
-
7
-
8
-
9
-
10
-
11
-
12
-
13
-
14
-
15
-
16
-
17
-
18
-
19
-
20
-
21
-
 22
22 -
 23
23 -
 24
24 -
 25
25 -
 26
26 -
 27
27 -
 28
28 -
 29
29 -
 30
30 -
 31
31 -
 32
32 -
 33
33 -
 34
34 -
 35
35 -
 36
36 -
 37
37 -
 38
38 -
 39
39 -
 40
40 -
 41
41 -
 42
42 -
43
-
44
-
45
-
46
-
47
-
48
-
49
-
50
-
51
-
52
-
53
-
54
-
55
-
56
-
57
-
58
-
59
-
60
-
61
-
62
-
63
-
64
-
65
-
66
-
67
-
68
-
69
-
70
-
71
-
72
-
73
-
74
-
75
-
76
-
77
-
78
-
79
-
80
-
81
-
82
-
83
-
84
-
85
-
86
-
87
-
88
-
89
-
90
-
91
-
92
-
93
-
94
-
95
-
96
-
97
-
98
 |
 |

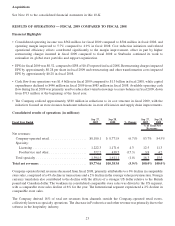
Fiscal Year Ended Sep 27,
2009 Sep 28,
2008 %
Change Sep 27,
2009 Sep 28,
2008
% of Total Net
Revenues
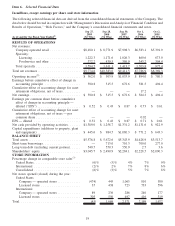
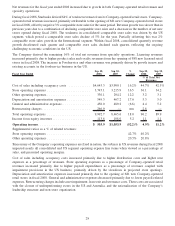
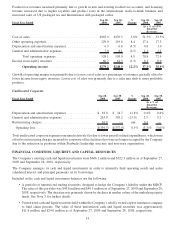
Cost of sales including occupancy costs .............. $4,324.9 $4,645.3 (6.9)% 44.2% 44.7%
Store operating expenses ......................... 3,425.1 3,745.1 (8.5) 35.0 36.1
Other operating expenses ......................... 264.4 330.1 (19.9) 2.7 3.2
Depreciation and amortization expenses .............. 534.7 549.3 (2.7) 5.5 5.3
General and administrative expenses ................ 453.0 456.0 (0.7) 4.6 4.4
Restructuring charges............................ 332.4 266.9 24.5 3.4 2.6
Total operating expenses ......................... 9,334.5 9,992.7 (6.6) 95.5 96.2
Income from equity investees...................... 121.9 113.6 7.3 1.2 1.1
Operating income............................ $ 562.0 $ 503.9 11.5% 5.7% 4.9%
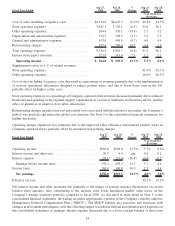
Supplemental ratios as a % of related revenues:
Store operating expenses ......................... 41.9% 42.7%
Other operating expenses ......................... 16.6% 20.5%
Cost of sales including occupancy costs decreased as a percentage of revenues primarily due to the implementation
of in-store operational efficiencies designed to reduce product waste, and due to lower dairy costs in the US,
partially offset by higher coffee costs.
Store operating expenses as a percentage of Company-operated retail revenues decreased primarily due to reduced
headcount and spending in the regional support organization as a result of Starbucks restructuring efforts, and the
effect of initiatives to improve store labor efficiencies.
Restructuring charges include lease exit and related costs associated with the actions to rationalize the Company’s
global store portfolio and reduce the global cost structure. See Note 2 to the consolidated financial statements for
further discussion.
Operating margin expansion was primarily due to the improved labor efficiency and reduced product waste in
Company-operated stores, partially offset by increased restructuring charges.
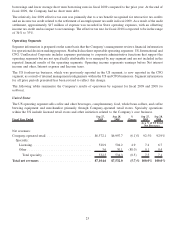
Fiscal Year Ended Sep 27,
2009 Sep 28,
2008 %
Change Sep 27,
2009 Sep 28,
2008
% of Total Net
Revenues
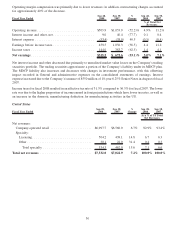
Operating income ................................. $562.0 $503.9 11.5% 5.7% 4.9%
Interest income and other, net ........................ 36.3 9.0 nm 0.4 0.1
Interest expense .................................. (39.1) (53.4) (26.8) (0.4) (0.5)
Earnings before income taxes ...................... 559.2 459.5 21.7 5.7 4.4
Income taxes. . . .................................. 168.4 144.0 16.9 1.7 1.4
Net earnings................................... $390.8 $315.5 23.9% 4.0% 3.0%
Effective tax rate.................................. 30.1% 31.3%
Net interest income and other increased due primarily to the impact of foreign currency fluctuations on certain
balance sheet amounts. Also contributing to the increase were lower unrealized market value losses on the
Company’s trading securities portfolio compared to fiscal 2008. As described in more detail in Note 3 to the
consolidated financial statements, the trading securities approximate a portion of the Company’s liability under its
Management Deferred Compensation Plan (“MDCP”). The MDCP liability also increases and decreases with
changes in investment performance, with this offsetting impact recorded in General and administrative expenses on
the consolidated statements of earnings. Interest expense decreased due to a lower average balance of short term
24