Starbucks 2009 Annual Report Download - page 30
Download and view the complete annual report
Please find page 30 of the 2009 Starbucks annual report below. You can navigate through the pages in the report by either clicking on the pages listed below, or by using the keyword search tool below to find specific information within the annual report.-
 1
1 -
2
-
3
-
4
-
5
-
6
-
7
-
8
-
9
-
10
-
11
-
12
-
13
-
14
-
15
-
16
-
17
-
18
-
19
-
 20
20 -
 21
21 -
 22
22 -
 23
23 -
 24
24 -
 25
25 -
 26
26 -
 27
27 -
 28
28 -
 29
29 -
 30
30 -
 31
31 -
 32
32 -
 33
33 -
 34
34 -
 35
35 -
 36
36 -
 37
37 -
 38
38 -
 39
39 -
 40
40 -
41
-
42
-
43
-
44
-
45
-
46
-
47
-
48
-
49
-
50
-
51
-
52
-
53
-
54
-
55
-
56
-
57
-
58
-
59
-
60
-
61
-
62
-
63
-
64
-
65
-
66
-
67
-
68
-
69
-
70
-
71
-
72
-
73
-
74
-
75
-
76
-
77
-
78
-
79
-
80
-
81
-
82
-
83
-
84
-
85
-
86
-
87
-
88
-
89
-
90
-
91
-
92
-
93
-
94
-
95
-
96
-
97
-
98
 |
 |
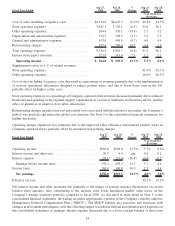
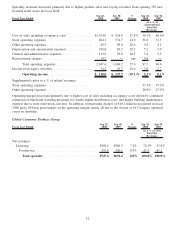
stores in the US and approximately 200 net new stores in International markets. Both the US and International net
new additions are expected to be primarily licensed stores.
Given these revenue expectations, combined with the Company’s reduced cost structure, in-store operating
efficiencies, and lower restructuring charges, Starbucks currently expects significant improvement in its consol-
idated operating margin in fiscal 2010. Operating cash flow for fiscal 2010 is currently expected to reach
approximately $1.4 billion and capital expenditures are expected to range from $500 million to $550 million.
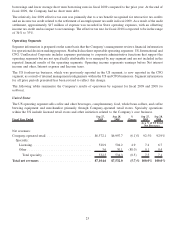
Operating Segment Overview
Starbucks has three reportable operating segments: US, International and CPG. The US foodservice business, which
was previously reported in the US segment, is now reported in the CPG segment, as a result of internal management
realignments within the US and CPG businesses. Segment information for all prior periods presented has been
revised to reflect this change.
The US and International segments bothinclude Company-operated retail stores and licensed retail stores. Licensed
stores frequently have a higher operating margin than Company-operated stores. Under the licensed model,
Starbucks receives a reduced share of the total store revenues, but this is more than offset by the reduction in its
share of costs as these are primarily borne by the licensee. The International segment has a higher relative share of
licensed stores versus Company-operated compared to the US segment; however, the US segment has been
operating significantly longer than the International segment and has developed deeper awareness of, and
attachment to, the Starbucks brand and stores among its customer base. As a result, the more mature US segment
has significantly more stores, and higher total revenues than the International segment. Average sales per store are
also higher in the US due to various factors including length of time in market and local income levels. Further,
certain market costs, particularly occupancy costs, are lower in the US segment compared to the average for the
International segment, which comprises a more diverse group of operations. As a result of the relative strength of the
brand in the US segment, the number of stores, the higher unit volumes, and the lower market costs, the US segment,
despite its higher relative percentage of Company-operated stores, has a higher operating margin, excluding
restructuring costs, than the less-developed International segment.
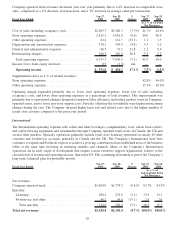
The Company’s International store base continues to expand and Starbucks has been focusing on achieving
sustainable growth from established international markets while at the same time investing in emerging markets,
such as China, Brazil and Russia. The Company’s newer international markets require a more extensive support
organization, relative to the current levels of revenue and operating income.
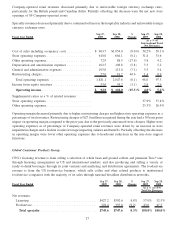
The CPG segment includes packaged coffee and tea, and other branded products operations worldwide, and the US
foodservice business. For the packaged coffee and tea and branded products, Starbucks operates primarily through
licensing arrangements and joint ventures with large consumer products business partners, most significantly with
Kraft for distribution of packaged coffees and teas, and The North American Coffee Partnership with the Pepsi-Cola
Company for manufacturing and distribution of ready-to-drink beverages. This operating model allows the CPG
segment to leverage the business partners’ existing infrastructures and to extend the Starbucks brand in an efficient
way. Most of the customer revenues from the packaged coffee and ready-to-drink products are recognized as
revenues by the licensed or joint venture business partner, not by the CPG segment. Royalties and payments from
our licensing agreements are recorded under licensing revenue, and the proportionate share of the results of the
Company’s joint ventures are included, on a net basis, in Income from equity investees on the consolidated
statements of earnings. The US foodservice business sells coffee and other related products to institutional
foodservice companies with the majority of its sales through national broadline distribution networks. The CPG
segment reflects relatively lower revenues, a modest cost structure, and a resulting higher operating margin,
compared to the Company’s other two reporting segments, which consist primarily of retail stores.
Expenses pertaining to corporate administrative functions that support the operating segments but are not
specifically attributable to or managed by any segment are not included in the reported financial results of the
operating segments. These unallocated corporate expenses include certain general and administrative expenses,
related depreciation and amortization expenses, corporate restructuring charges and amounts included in Net
interest income and other and Interest expense on the consolidated statements of earnings.
22