Starbucks 2009 Annual Report Download - page 48
Download and view the complete annual report
Please find page 48 of the 2009 Starbucks annual report below. You can navigate through the pages in the report by either clicking on the pages listed below, or by using the keyword search tool below to find specific information within the annual report.-
 1
1 -
2
-
3
-
4
-
5
-
6
-
7
-
8
-
9
-
10
-
11
-
12
-
13
-
14
-
15
-
16
-
17
-
18
-
19
-
20
-
21
-
22
-
23
-
24
-
25
-
26
-
27
-
28
-
29
-
30
-
31
-
32
-
33
-
34
-
35
-
36
-
37
-
 38
38 -
 39
39 -
 40
40 -
 41
41 -
 42
42 -
 43
43 -
 44
44 -
 45
45 -
 46
46 -
 47
47 -
 48
48 -
 49
49 -
 50
50 -
 51
51 -
 52
52 -
 53
53 -
 54
54 -
 55
55 -
 56
56 -
 57
57 -
 58
58 -
59
-
60
-
61
-
62
-
63
-
64
-
65
-
66
-
67
-
68
-
69
-
70
-
71
-
72
-
73
-
74
-
75
-
76
-
77
-
78
-
79
-
80
-
81
-
82
-
83
-
84
-
85
-
86
-
87
-
88
-
89
-
90
-
91
-
92
-
93
-
94
-
95
-
96
-
97
-
98
 |
 |

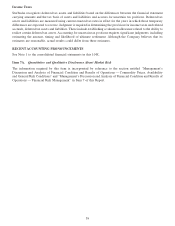
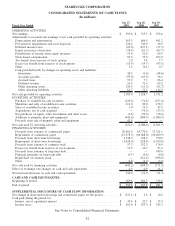
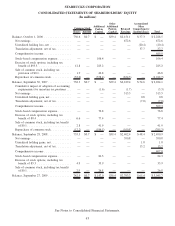
Item 8. Financial Statements and Supplementary Data
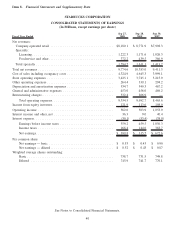
STARBUCKS CORPORATION
CONSOLIDATED STATEMENTS OF EARNINGS
(In Millions, except earnings per share)
Fiscal Year Ended Sep 27,
2009 Sep 28,
2008 Sep 30,
2007
Net revenues:
Company-operated retail ................................... $8,180.1 $ 8,771.9 $7,998.3
Specialty:
Licensing ............................................. 1,222.3 1,171.6 1,026.3
Foodservice and other.................................... 372.2 439.5 386.9
Total specialty ........................................... 1,594.5 1,611.1 1,413.2
Total net revenues .......................................... 9,774.6 10,383.0 9,411.5
Cost of sales including occupancy costs .......................... 4,324.9 4,645.3 3,999.1
Store operating expenses ..................................... 3,425.1 3,745.1 3,215.9
Other operating expenses ..................................... 264.4 330.1 294.2
Depreciation and amortization expenses .......................... 534.7 549.3 467.2
General and administrative expenses ............................ 453.0 456.0 489.2
Restructuring charges........................................ 332.4 266.9 —
Total operating expenses.................................. 9,334.5 9,992.7 8,465.6
Income from equity investees.................................. 121.9 113.6 108.0
Operating income .......................................... 562.0 503.9 1,053.9
Interest income and other, net ................................. 36.3 9.0 40.4
Interest expense............................................ (39.1) (53.4) (38.0)
Earnings before income taxes .............................. 559.2 459.5 1,056.3
Income taxes .......................................... 168.4 144.0 383.7
Net earnings........................................... $ 390.8 $ 315.5 $ 672.6
Per common share:
Net earnings — basic .................................... $ 0.53 $ 0.43 $ 0.90
Net earnings — diluted ................................... $ 0.52 $ 0.43 $ 0.87
Weighted average shares outstanding:
Basic ................................................ 738.7 731.5 749.8
Diluted .............................................. 745.9 741.7 770.1
See Notes to Consolidated Financial Statements.
40