Sysco 2008 Annual Report Download - page 26
Download and view the complete annual report
Please find page 26 of the 2008 Sysco annual report below. You can navigate through the pages in the report by either clicking on the pages listed below, or by using the keyword search tool below to find specific information within the annual report.-
 1
1 -
2
-
3
-
4
-
5
-
6
-
7
-
8
-
9
-
10
-
11
-
12
-
13
-
14
-
15
-
 16
16 -
 17
17 -
 18
18 -
 19
19 -
 20
20 -
 21
21 -
 22
22 -
 23
23 -
 24
24 -
 25
25 -
 26
26 -
 27
27 -
 28
28 -
 29
29 -
 30
30 -
 31
31 -
 32
32 -
 33
33 -
 34
34 -
 35
35 -
 36
36 -
37
-
38
-
39
-
40
-
41
-
42
-
43
-
44
-
45
-
46
-
47
-
48
-
49
-
50
-
51
-
52
-
53
-
54
-
55
-
56
-
57
-
58
-
59
-
60
-
61
-
62
-
63
-
64
-
65
-
66
-
67
-
68
-
69
-
70
-
71
-
72
-
73
-
74
-
75
-
76
-
77
-
78
-
79
-
80
-
81
-
82
-
83
-
84
-
85
-
86
-
87
-
88
-
89
-
90
-
91
-
92
-
93
-
94
-
95
-
96
 |
 |

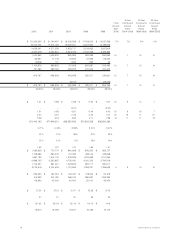
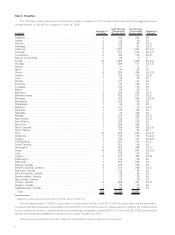
A comparison of the sales mix in the principal product categories during the last three years is presented below:
2008 2007 2006
Canned and dry products . . . . . . . . . . . . . . . . . . . . . . . . . . . . . . . . . . . . . . . . . . . . . . . . . . . . . . . . . . 18% 18% 18%
Fresh and frozen meats . . . . . . . . . . . . . . . . . . . . . . . . . . . . . . . . . . . . . . . . . . . . . . . . . . . . . . . . . . . 18 19 19
Frozen fruits, vegetables, bakery and other . . . . . . . . . . . . . . . . . . . . . . . . . . . . . . . . . . . . . . . . . . . . . 14 13 14
Dairy products. . . . . . . . . . . . . . . . . . . . . . . . . . . . . . . . . . . . . . . . . . . . . . . . . . . . . . . . . . . . . . . . . . 11 9 9
Poultry . . . . . . . . . . . . . . . . . . . . . . . . . . . . . . . . . . . . . . . . . . . . . . . . . . . . . . . . . . . . . . . . . . . . . . . 10 10 10
Fresh produce. . . . . . . . . . . . . . . . . . . . . . . . . . . . . . . . . . . . . . . . . . . . . . . . . . . . . . . . . . . . . . . . . . 8 9 9
Paper and disposables . . . . . . . . . . . . . . . . . . . . . . . . . . . . . . . . . . . . . . . . . . . . . . . . . . . . . . . . . . . . 8 8 8
Seafood . . . . . . . . . . . . . . . . . . . . . . . . . . . . . . . . . . . . . . . . . . . . . . . . . . . . . . . . . . . . . . . . . . . . . . 5 5 5
Beverage products . . . . . . . . . . . . . . . . . . . . . . . . . . . . . . . . . . . . . . . . . . . . . . . . . . . . . . . . . . . . . . 3 3 3
Janitorial products . . . . . . . . . . . . . . . . . . . . . . . . . . . . . . . . . . . . . . . . . . . . . . . . . . . . . . . . . . . . . . . 3 3 2
Equipment and smallwares . . . . . . . . . . . . . . . . . . . . . . . . . . . . . . . . . . . . . . . . . . . . . . . . . . . . . . . . 2 2 2
Medical supplies . . . . . . . . . . . . . . . . . . . . . . . . . . . . . . . . . . . . . . . . . . . . . . . . . . . . . . . . . . . . . . . . * 1 1
100% 100% 100%
* Sales are less than 1% of total
Our operating companies distribute nationally-branded merchandise, as well as products packaged under our private brands. Products
packaged under our private brands have been manufactured for SYSCO according to specifications that have been developed by our quality
assurance team. In addition, our quality assurance team certifies the manufacturing and processing plants where these products are
packaged, enforces our quality control standards and identifies supply sources that satisfy our requirements.
We believe that prompt and accurate delivery of orders, close contact with customers and the ability to provide a full array of products
and services to assist customers in their foodservice operations are of primary importance in the marketing and distribution of products to
traditional customers. Our operating companies offer daily delivery to certain customer locations and have the capability of delivering
special orders on short notice. Through our more than 14,000 sales and marketing representatives and support staff of SYSCO and our
operating companies, we stay informed of the needs of our customers and acquaint them with new products and services. Our operating
companies also provide ancillary services relating to foodservice distribution, such as providing customers with product usage reports and
other data, menu-planning advice, food safety training and assistance in inventory control, as well as access to various third party services
designed to add value to our customers’ businesses.
No single customer accounted for 10% or more of our total sales for the fiscal year ended June 28, 2008.
Our sales to chain restaurant customers consist of a variety of food products. We believe that consistent product quality and timely and
accurate service are important factors when a chain restaurant selects a foodservice supplier. One chain restaurant customer (Wendy’s
International, Inc.) accounted for 5% of our sales for the fiscal year ended June 28, 2008. Although this customer represents approximately
34% of the SYGMA segment sales, we do not believe that the loss of this customer would have a material adverse effect on SYSCO as a
whole.
Based upon available information, we estimate that sales by type of customer during the past three fiscal years were as follows:
Type of Customer 2008 2007 2006
Restaurants . . . . . . . . . . . . . . . . . . . . . . . . . . . . . . . . . . . . . . . . . . . . . . . . . . . . . . . . . . . . . . . . . . . 63% 64% 63%
Hospitals and nursing homes . . . . . . . . . . . . . . . . . . . . . . . . . . . . . . . . . . . . . . . . . . . . . . . . . . . . . . . 10 10 10
Schools and colleges . . . . . . . . . . . . . . . . . . . . . . . . . . . . . . . . . . . . . . . . . . . . . . . . . . . . . . . . . . . . . 5 5 5
Hotels and motels . . . . . . . . . . . . . . . . . . . . . . . . . . . . . . . . . . . . . . . . . . . . . . . . . . . . . . . . . . . . . . . 6 6 6
Other . . . . . . . . . . . . . . . . . . . . . . . . . . . . . . . . . . . . . . . . . . . . . . . . . . . . . . . . . . . . . . . . . . . . . . . . 16 15 16
Totals . . . . . . . . . . . . . . . . . . . . . . . . . . . . . . . . . . . . . . . . . . . . . . . . . . . . . . . . . . . . . . . . . . . . . . 100% 100% 100%
Sources of Supply
We purchase from thousands of suppliers, both domestic and international, none of which individually accounts for more than 10% of
our purchases. These suppliers consist generally of large corporations selling brand name and private label merchandise, as well as
independent regional brand and private label processors and packers. Generally, purchasing is carried out through centrally developed
purchasing programs and direct purchasing programs established by our various operating companies.We continually develop relationships
with our suppliers.
SYSCO’s Baugh Supply Chain Cooperative, Inc. (BSCC) administers a consolidated product procurement program designed to develop,
obtain and ensure consistent quality food and non-food products. The program covers the purchasing and marketing of SYSCO Brand
merchandise as well as products from a number of national brand suppliers, encompassing substantially all product lines. SYSCO’s
operating companies purchase product from the suppliers participating in the cooperative’s programs and from other suppliers, although
SYSCO Brand products are only available to the operating companies through the cooperative’s programs.
SYSCO’s National Supply Chain group is focused on increasing profitability by lowering aggregate inventory levels, operating costs, and
future facility expansion needs at our broadline operating companies while providing greater value to our suppliers and customers.
2