Sysco 2008 Annual Report Download - page 3
Download and view the complete annual report
Please find page 3 of the 2008 Sysco annual report below. You can navigate through the pages in the report by either clicking on the pages listed below, or by using the keyword search tool below to find specific information within the annual report.-
 1
1 -
 2
2 -
 3
3 -
 4
4 -
 5
5 -
 6
6 -
 7
7 -
 8
8 -
 9
9 -
 10
10 -
 11
11 -
 12
12 -
 13
13 -
 14
14 -
15
-
16
-
17
-
18
-
19
-
20
-
21
-
22
-
23
-
24
-
25
-
26
-
27
-
28
-
29
-
30
-
31
-
32
-
33
-
34
-
35
-
36
-
37
-
38
-
39
-
40
-
41
-
42
-
43
-
44
-
45
-
46
-
47
-
48
-
49
-
50
-
51
-
52
-
53
-
54
-
55
-
56
-
57
-
58
-
59
-
60
-
61
-
62
-
63
-
64
-
65
-
66
-
67
-
68
-
69
-
70
-
71
-
72
-
73
-
74
-
75
-
76
-
77
-
78
-
79
-
80
-
81
-
82
-
83
-
84
-
85
-
86
-
87
-
88
-
89
-
90
-
91
-
92
-
93
-
94
-
95
-
96
 |
 |
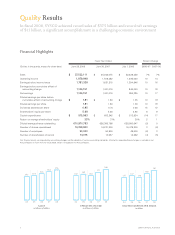
Fiscal Year Ended Percent Change
(Dollars in thousands, except for share data) June 28, 2008 June 30, 2007 July 1, 2006 2008–07 2007–06
Sales $ 37,522,111 $ 35,042,075 $ 32,628,438 7% 7%
Operating income 1,879,949 1,708,482 1,495,030 10 14
Earnings before income taxes 1,791,338 1,621,215 1,394,946 10 16
Earnings before cumulative effect of
accounting change 1,10 6,1 51 1,001,076 846,040 10 18
Net earnings 1,106,151 1,001,076 855,325 10 17
Diluted earnings per share before
cumulative effect of accounting change $ 1.81 $ 1.60 $ 1.35 13 19
Diluted earnings per share 1.81 1.60 1.36 13 18
Dividends declared per share 0.85 0.74 0.66 15 12
Shareholders’ equity per share 5.68 5.36 4.93 6 9
Capital expenditures $ 515,963 $ 603,242 $ 513,934 (14) 17
Return on average shareholders’ equity 33% 31% 30% 2 1
Diluted average shares outstanding 610,970,783 626,366,798 628,800,647 (2) 0
Number of shares repurchased 16,769,900 16,231,200 16,479,800 3 (2)
Number of employees 50,000 50,900 49,600 (2) 3
Number of shareholders of record 13,015 13,557 14,282 (4) (5)
Our financial results are impacted by accounting changes and the adoption of various accounting standards. Information regarding these changes is available in our
Annual Report on Form 10-K for fiscal 2008, which is included in this Annual Report.
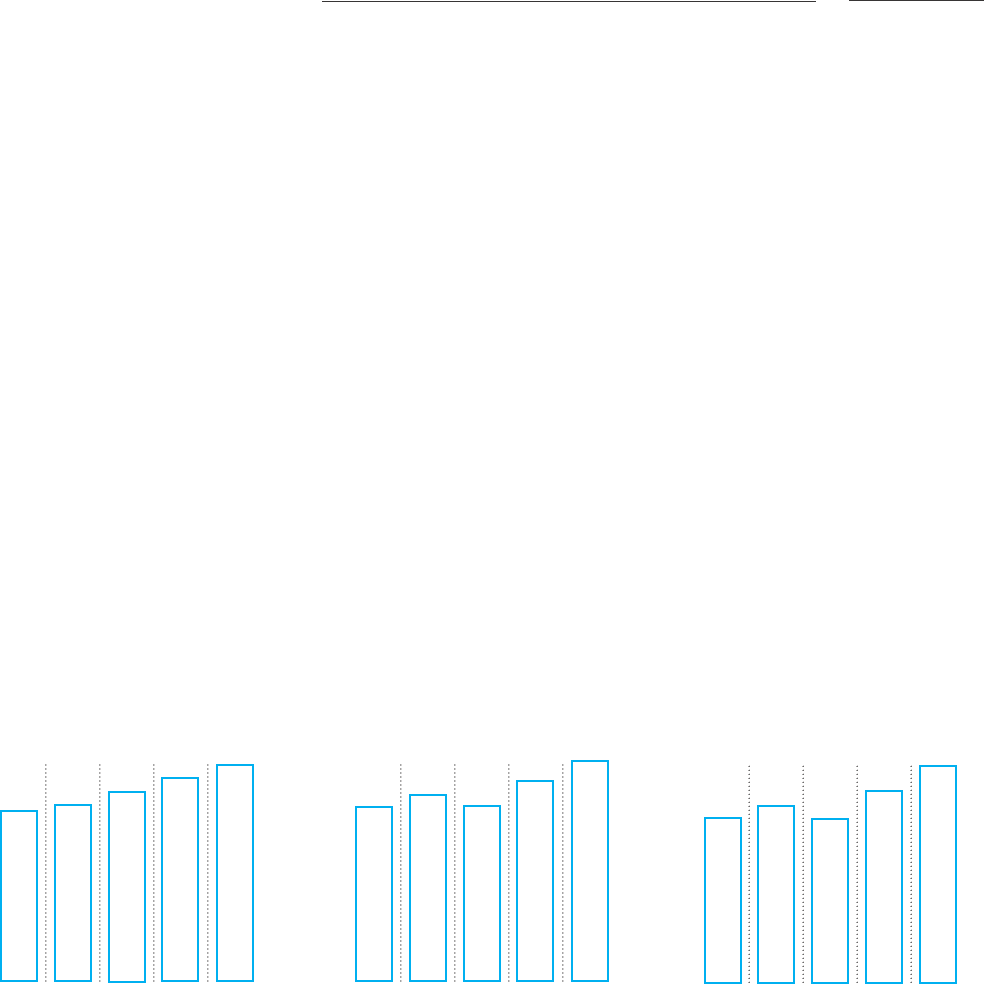
04
29.3
05
30.3
06
32.6
SaLES
in b∏lions of d∫lars
07
35.0
08
37. 5
04
1.37
05
1.47
06
1.36
DiLUtED EarninGS pEr SHarE
in d∫lars
07
1.60
08
1.81
04
1.53
05
1.60
06
1.50
OpEratinG inCOME
in b∏lions of d∫lars
07
1.71
08
1.88