Sysco 2008 Annual Report Download - page 36
Download and view the complete annual report
Please find page 36 of the 2008 Sysco annual report below. You can navigate through the pages in the report by either clicking on the pages listed below, or by using the keyword search tool below to find specific information within the annual report.-
 1
1 -
2
-
3
-
4
-
5
-
6
-
7
-
8
-
9
-
10
-
11
-
12
-
13
-
14
-
15
-
16
-
17
-
18
-
19
-
20
-
21
-
22
-
23
-
24
-
25
-
 26
26 -
 27
27 -
 28
28 -
 29
29 -
 30
30 -
 31
31 -
 32
32 -
 33
33 -
 34
34 -
 35
35 -
 36
36 -
 37
37 -
 38
38 -
 39
39 -
 40
40 -
 41
41 -
 42
42 -
 43
43 -
 44
44 -
 45
45 -
 46
46 -
47
-
48
-
49
-
50
-
51
-
52
-
53
-
54
-
55
-
56
-
57
-
58
-
59
-
60
-
61
-
62
-
63
-
64
-
65
-
66
-
67
-
68
-
69
-
70
-
71
-
72
-
73
-
74
-
75
-
76
-
77
-
78
-
79
-
80
-
81
-
82
-
83
-
84
-
85
-
86
-
87
-
88
-
89
-
90
-
91
-
92
-
93
-
94
-
95
-
96
 |
 |
Item 7. Management’s Discussion and Analysis of Financial Condition and Results of Operations
Highlights
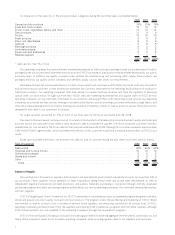
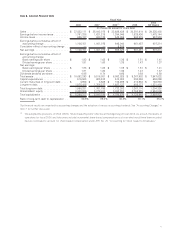
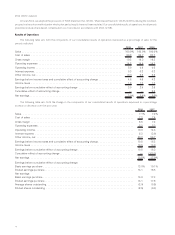
Sales increased 7.1% in fiscal 2008 over the prior year. Product costs increased an estimated 6.0% during fiscal 2008 over the prior
year. Operating income increased to $1,879,949,000 and 5.0% of sales, a 10.0% increase over the prior year. Net earnings and diluted
earnings per share increased 10.5% and 13.1%, respectively, over the prior year.
Fiscal 2008 provided a challenging economic environment. Our industry is experiencing various macro-economic pressures, including
high fuel costs, rising food prices and general economic conditions which are pressuring consumer disposable income. These factors
restricted growth in fiscal 2008 and are continuing into fiscal 2009. High food cost inflation, which we began to experience in the fourth
quarter of fiscal 2007, prevailed throughout fiscal 2008. In spite of these conditions, our operating companies managed margins and
expenses effectively. Gross profit dollars increased 6.5% in fiscal 2008, while operating expenses grew only 5.3% over the prior year.
Operating income was negatively impacted by additional expenses from the combined impact of losses on the adjustment of the
carrying value of corporate-owned life insurance policies to their cash surrender values as compared to gains in fiscal 2007 and increased
provisions related to multi-employer pension plans. The negative impact of these additional expenses was partially offset by lower share-
based compensation expense and lower company-sponsored pension expenses. In addition, fuel costs increased in fiscal 2008, driven by
higher fuel prices. We partially offset the impact of the higher fuel costs through fuel usage reduction measures as well as fuel surcharges.
We expect fuel costs in fiscal 2009 to be greater than in fiscal 2008.
Overview
SYSCO distributes food and related products to restaurants, healthcare and educational facilities, lodging establishments and other
foodservice customers. Our operations are located throughout the United States and Canada and include broadline companies, specialty
produce companies, custom-cut meat operations, hotel supply operations, SYGMA (our chain restaurant distribution subsidiary) and a
company that distributes to international customers.
We estimate that we serve about 16% of an approximately $231 billion annual market.This market includes i) the foodservice market in
the United States and Canada and ii) the hotel amenity and hotel furniture and textile market in the United States, Canada, Europe and Asia.
According to industry sources, the foodservice, or food-prepared-away-from-home, market represents approximately one-half of the total
dollars spent on food purchases made at the consumer level. This share grew from about 37% in 1972 to about 50% in 1998 and has not
changed materially since that time.
Industry sources estimate the total foodservice market experienced real sales growth of approximately 1.3% in calendar year 2007 and
1.9% in calendar year 2006.
General economic conditions and consumer confidence can affect the frequency of purchases and amounts spent by consumers for
food-prepared-away-from-home and, in turn, can impact our customers and our sales. We believe the current general economic conditions,
including pressure on consumer disposable income, are contributing to a decline in the foodservice market. Historically, we have grown at a
faster rate than the overall industry and have grown our market share in this fragmented industry. We intend to continue our efforts to
expand our market share and grow earnings by focusing on sales growth, margin management, productivity gains and supply chain
management.
Strategic Business Initiatives
SYSCO maintains strategic focus areas which aim to help us achieve our long-term vision of becoming the global leader of the efficient,
multi-temperature food product value chain. The following areas generally comprise the initiatives that are currently serving as the
foundation of our efforts to ensure a sustainable future.
•Sourcing and National Supply Chain focuses on lowering our cost of goods sold by leveraging SYSCO’s purchasing power and
procurement expertise and capitalizing on an end-to-end view of our supply chain. Our National Supply Chain initiative is focused
on lowering inventory, inbound freight, product costs, operating costs, working capital requirements and future facility expansion
needs at our operating companies while providing greater value to our suppliers and customers.
•Integrated Delivery focuses on standardized processes to optimize warehouse and delivery activities across the corporation and
manage energy consumption to achieve a more efficient delivery of products to our customers.
•Demand explores and implements practices to better understand and more profitably sell to and service SYSCO’s customers,
including better tools and processes for selling.
•Organizational Capabilities works to align management reporting, information technology systems and performance measures with
the business initiatives.
A major component of our National Supply Chain is the use of redistribution centers (RDCs). The first RDC, the Northeast RDC located
in Front Royal,Virginia, opened during the third quarter of fiscal 2005. Construction of our second RDC in Alachua, Florida was completed in
12