Sysco 2008 Annual Report Download - page 42
Download and view the complete annual report
Please find page 42 of the 2008 Sysco annual report below. You can navigate through the pages in the report by either clicking on the pages listed below, or by using the keyword search tool below to find specific information within the annual report.-
 1
1 -
2
-
3
-
4
-
5
-
6
-
7
-
8
-
9
-
10
-
11
-
12
-
13
-
14
-
15
-
16
-
17
-
18
-
19
-
20
-
21
-
22
-
23
-
24
-
25
-
26
-
27
-
28
-
29
-
30
-
31
-
 32
32 -
 33
33 -
 34
34 -
 35
35 -
 36
36 -
 37
37 -
 38
38 -
 39
39 -
 40
40 -
 41
41 -
 42
42 -
 43
43 -
 44
44 -
 45
45 -
 46
46 -
 47
47 -
 48
48 -
 49
49 -
 50
50 -
 51
51 -
 52
52 -
53
-
54
-
55
-
56
-
57
-
58
-
59
-
60
-
61
-
62
-
63
-
64
-
65
-
66
-
67
-
68
-
69
-
70
-
71
-
72
-
73
-
74
-
75
-
76
-
77
-
78
-
79
-
80
-
81
-
82
-
83
-
84
-
85
-
86
-
87
-
88
-
89
-
90
-
91
-
92
-
93
-
94
-
95
-
96
 |
 |

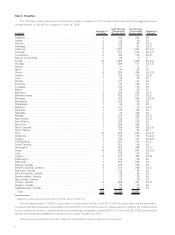
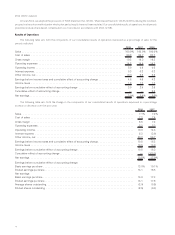
The following table sets forth the change in the selected financial data of each of our reportable segments and the other segment
expressed as a percentage increase over the prior year and should be read in conjunction with Business Segment Information in Note 19 to
the Consolidated Financial Statements in Item 8:
Sales
Operating
Income Sales
Operating
Income
2008 2007
Broadline . . . . . . . . . . . . . . . . . . . . . . . . . . . . . . . . . . . . . . . . . . . . . . . . . . . . . . . 8.1% 9.1% 7.0% 9.4%
SYGMA . . . . . . . . . . . . . . . . . . . . . . . . . . . . . . . . . . . . . . . . . . . . . . . . . . . . . . . . 4.4 (23.8) 6.0
(1)
Other . . . . . . . . . . . . . . . . . . . . . . . . . . . . . . . . . . . . . . . . . . . . . . . . . . . . . . . . . 1.4 3.3 13.8 6.2
(1)
SYGMA had operating income of $10,842,000 in fiscal 2007 and an operating loss of $371,000 in fiscal 2006.
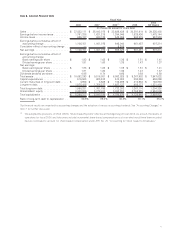
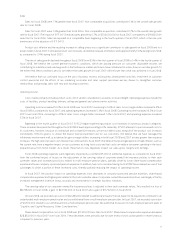
The following table sets forth sales and operating income of each of our reportable segments, the other segment, intersegment sales
and corporate expenses and consolidated adjustments, including certain centrally incurred costs for shared services that are charged to our
segments of which intercompany amounts are eliminated upon consolidation, expressed as a percentage of the respective consolidated
total and should be read in conjunction with Business Segment Information in Note 19 to the Consolidated Financial Statements in Item 8:
Sales
Operating
Income Sales
Operating
Income Sales
Operating
Income
2008 2007 2006
Broadline . . . . . . . . . . . . . . . . . . . . . . . . . . . . . . . . . . . . . . . . . . . 79.4% 103.1% 78.6% 104.0% 78.9% 108.6%
SYGMA . . . . . . . . . . . . . . . . . . . . . . . . . . . . . . . . . . . . . . . . . . . . 12.2 0.4 12.5 0.6 12.7 0.0
Other . . . . . . . . . . . . . . . . . . . . . . . . . . . . . . . . . . . . . . . . . . . . . . 9.7 7.3 10.2 7.8 9.6 8.4
Intersegment sales . . . . . . . . . . . . . . . . . . . . . . . . . . . . . . . . . . . . (1.3) — (1.3) — (1.2) —
Corporate expenses and consolidated adjustments . . . . . . . . . . . . . — (10.8) — (12.4) — (17.0)
Total . . . . . . . . . . . . . . . . . . . . . . . . . . . . . . . . . . . . . . . . . . . . . . 100.0% 100.0% 100.0% 100.0% 100.0% 100.0%
Included in corporate expenses and consolidated adjustments, among other items, are:
• Gains and losses recognized to adjust corporate-owned life insurance policies to their cash surrender values;
• Share-based compensation expense related to stock option grants, issuances of stock pursuant to the Employees’ Stock Purchase
Plan and stock grants to non-employee directors; and
• Corporate-level depreciation and amortization expense.
Broadline Segment
Broadline operating companies distribute a full line of food products and a wide variety of non-food products to both traditional and
chain restaurant customers. Broadline operations have significantly higher operating margins than the rest of SYSCO’s operations. In fiscal
2008, the Broadline operating results represent approximately 80% of SYSCO’s overall sales and greater than 100% of SYSCO’s overall
operating income prior to corporate expenses and consolidated adjustments.
There are several factors which contribute to these higher operating results as compared to the SYGMA and Other operating segments.
We have invested substantial amounts in assets, operating methods, technology and management expertise in this segment.The breadth of
its sales force, geographic reach of its distribution area and purchasing power allow us to leverage this segment’s earnings.
Sales
Sales for fiscal 2008 were 8.1% greater than fiscal 2007. Non-comparable acquisitions did not have a material impact on the overall
sales growth rate for fiscal 2008. Fiscal 2008 growth was realized both from increased sales to multi-unit customers and marketing
associate-served customers primarily through continued focus on customer account penetration through the use of business reviews with
customers and efforts of our marketing associates. Product cost inflation and the resulting increases in selling prices was the primary
contributor to sales growth.
Sales for fiscal 2007 were 7.0% greater than fiscal 2006.The impact of EITF 04-13 reduced sales growth by 0.4%, or $173,171,000, for
fiscal 2007 compared to a $57,211,000 reduction for fiscal 2006. Sales are reported on a comparable basis beginning in the fourth quarter of
fiscal 2007, which is the one-year anniversary of the adoption of EITF 04-13. Non-comparable acquisitions did not have an impact on the
overall sales growth rate for fiscal 2007. Fiscal 2007 growth was primarily due to increased sales to marketing associate-served customers
and multi-unit customers primarily through continued focus on customer account penetration through the use of business reviews with
customers, increases in the number of customer contact personnel and efforts of our marketing associates.
Operating Income
The increases in operating income in fiscal 2008 over fiscal 2007 were primarily due to gross margin dollars increasing at a faster pace
than expenses. We were able to manage our business effectively in the current inflationary environment by managing margins and
improving operating efficiencies. Gross margin dollars increased 7.0% while operating expenses increased 6.1% in fiscal 2008 over fiscal
2007. The high cost of fuel also impacted our results. Fuel costs in fiscal 2008 were $21,575,000 higher than fiscal 2007. We attempt to
18