Sysco 2008 Annual Report Download - page 35
Download and view the complete annual report
Please find page 35 of the 2008 Sysco annual report below. You can navigate through the pages in the report by either clicking on the pages listed below, or by using the keyword search tool below to find specific information within the annual report.-
 1
1 -
2
-
3
-
4
-
5
-
6
-
7
-
8
-
9
-
10
-
11
-
12
-
13
-
14
-
15
-
16
-
17
-
18
-
19
-
20
-
21
-
22
-
23
-
24
-
 25
25 -
 26
26 -
 27
27 -
 28
28 -
 29
29 -
 30
30 -
 31
31 -
 32
32 -
 33
33 -
 34
34 -
 35
35 -
 36
36 -
 37
37 -
 38
38 -
 39
39 -
 40
40 -
 41
41 -
 42
42 -
 43
43 -
 44
44 -
 45
45 -
46
-
47
-
48
-
49
-
50
-
51
-
52
-
53
-
54
-
55
-
56
-
57
-
58
-
59
-
60
-
61
-
62
-
63
-
64
-
65
-
66
-
67
-
68
-
69
-
70
-
71
-
72
-
73
-
74
-
75
-
76
-
77
-
78
-
79
-
80
-
81
-
82
-
83
-
84
-
85
-
86
-
87
-
88
-
89
-
90
-
91
-
92
-
93
-
94
-
95
-
96
 |
 |

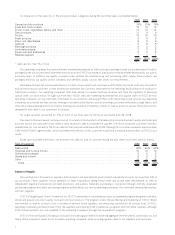
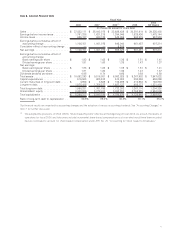
Item 6. Selected Financial Data
2008 2007 2006
(1)
2005
2004
(53 Weeks)
Fiscal Year
(In thousands except for share data)
Sales . . . . . . . . . . . . . . . . . . . . . . . . . . . $ 37,522,111 $ 35,042,075 $ 32,628,438 $ 30,281,914 $ 29,335,403
Earnings before income taxes . . . . . . . . . 1,791,338 1,621,215 1,394,946 1,525,436 1,475,144
Income taxes . . . . . . . . . . . . . . . . . . . . . 685,187 620,139 548,906 563,979 567,930
Earnings before cumulative effect of
accounting change . . . . . . . . . . . . . . . . 1,106,151 1,001,076 846,040 961,457 907,214
Cumulative effect of accounting change . . — — 9,285 — —
Net earnings. . . . . . . . . . . . . . . . . . . . . . $ 1,106,151 $ 1,001,076 $ 855,325 $ 961,457 $ 907,214
Earnings before cumulative effect of
accounting change:
Basic earnings per share . . . . . . . . . . . $ 1.83 $ 1.62 $ 1.36 $ 1.51 $ 1.41
Diluted earnings per share . . . . . . . . . . 1.81 1.60 1.35 1.47 1.37
Net earnings:
Basic earnings per share . . . . . . . . . . . $ 1.83 $ 1.62 $ 1.38 $ 1.51 $ 1.41
Diluted earnings per share . . . . . . . . . . 1.81 1.60 1.36 1.47 1.37
Dividends declared per share . . . . . . . . . . 0.85 0.74 0.66 0.58 0.50
Total assets . . . . . . . . . . . . . . . . . . . . . . $ 10,082,293 $ 9,518,931 $ 8,992,025 $ 8,267,902 $ 7,847,632
Capital expenditures . . . . . . . . . . . . . . . . 515,963 603,242 513,934 390,026 530,086
Current maturities of long-term debt. . . . . $ 4,896 $ 3,568 $ 106,265 $ 410,933 $ 162,833
Long-term debt . . . . . . . . . . . . . . . . . . . . 1,975,435 1,758,227 1,627,127 956,177 1,231,493
Total long-term debt . . . . . . . . . . . . . . . . 1,980,331 1,761,795 1,733,392 1,367,110 1,394,326
Shareholders’ equity . . . . . . . . . . . . . . . . 3,408,986 3,278,400 3,052,284 2,758,839 2,564,506
Total capitalization . . . . . . . . . . . . . . . . . . $ 5,389,317 $ 5,040,195 $ 4,785,676 $ 4,125,949 $ 3,958,832
Ratio of long-term debt to capitalization . . 36.8% 35.0% 36.2% 33.1% 35.2%
Our financial results are impacted by accounting changes and the adoption of various accounting standards. See “Accounting Changes” in
Item 7 for further discussion.
(1)
We adopted the provisions of SFAS 123(R), “Share-Based Payment” effective at the beginning of fiscal 2006. As a result, the results of
operations for fiscal 2006 and later years include incremental share-based compensation cost over what would have been recorded
had we continued to account for share-based compensation under APB No. 25, “Accounting for Stock Issued to Employees.”
11