Sysco 2008 Annual Report Download - page 62
Download and view the complete annual report
Please find page 62 of the 2008 Sysco annual report below. You can navigate through the pages in the report by either clicking on the pages listed below, or by using the keyword search tool below to find specific information within the annual report.-
 1
1 -
2
-
3
-
4
-
5
-
6
-
7
-
8
-
9
-
10
-
11
-
12
-
13
-
14
-
15
-
16
-
17
-
18
-
19
-
20
-
21
-
22
-
23
-
24
-
25
-
26
-
27
-
28
-
29
-
30
-
31
-
32
-
33
-
34
-
35
-
36
-
37
-
38
-
39
-
40
-
41
-
42
-
43
-
44
-
45
-
46
-
47
-
48
-
49
-
50
-
51
-
 52
52 -
 53
53 -
 54
54 -
 55
55 -
 56
56 -
 57
57 -
 58
58 -
 59
59 -
 60
60 -
 61
61 -
 62
62 -
 63
63 -
 64
64 -
 65
65 -
 66
66 -
 67
67 -
 68
68 -
 69
69 -
 70
70 -
 71
71 -
 72
72 -
73
-
74
-
75
-
76
-
77
-
78
-
79
-
80
-
81
-
82
-
83
-
84
-
85
-
86
-
87
-
88
-
89
-
90
-
91
-
92
-
93
-
94
-
95
-
96
 |
 |

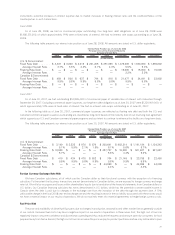
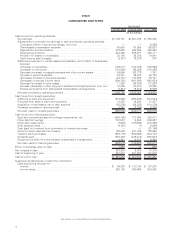
SYSCO
CONSOLIDATED CASH FLOWS
June 28, 2008 June 30, 2007 July 1, 2006
Year Ended
(In thousands)
Cash flows from operating activities:
Net earnings . . . . . . . . . . . . . . . . . . . . . . . . . . . . . . . . . . . . . . . . . . . . . . . . . . $1,106,151 $1,001,076 $ 855,325
Adjustments to reconcile net earnings to cash provided by operating activities:
Cumulative effect of accounting change, net of tax . . . . . . . . . . . . . . . . . . . . . — — (9,285)
Share-based compensation expense . . . . . . . . . . . . . . . . . . . . . . . . . . . . . . . . 80,650 97,985 126,837
Depreciation and amortization . . . . . . . . . . . . . . . . . . . . . . . . . . . . . . . . . . . . 372,529 362,559 345,062
Deferred tax provision . . . . . . . . . . . . . . . . . . . . . . . . . . . . . . . . . . . . . . . . . . 643,480 545,971 482,111
Provision for losses on receivables . . . . . . . . . . . . . . . . . . . . . . . . . . . . . . . . . 32,184 28,156 19,841
(Gain) loss on sale of assets. . . . . . . . . . . . . . . . . . . . . . . . . . . . . . . . . . . . . . (2,747) (6,279) 847
Additional investment in certain assets and liabilities, net of effect of businesses
acquired:
(Increase) in receivables. . . . . . . . . . . . . . . . . . . . . . . . . . . . . . . . . . . . . . . . . (128,017) (134,153) (162,586)
(Increase) in inventories . . . . . . . . . . . . . . . . . . . . . . . . . . . . . . . . . . . . . . . . . (110,925) (95,932) (119,392)
Decrease (increase) in prepaid expenses and other current assets . . . . . . . . . . 59,896 (62,773) 1,741
Increase in accounts payable . . . . . . . . . . . . . . . . . . . . . . . . . . . . . . . . . . . . . 54,451 85,422 49,775
(Decrease) increase in accrued expenses . . . . . . . . . . . . . . . . . . . . . . . . . . . . (22,721) 132,936 29,161
(Decrease) in accrued income taxes . . . . . . . . . . . . . . . . . . . . . . . . . . . . . . . . (509,783) (491,993) (545,634)
Decrease (increase) in other assets . . . . . . . . . . . . . . . . . . . . . . . . . . . . . . . . 11,926 (36,426) (17,937)
Increase (decrease) in other long-term liabilities and prepaid pension cost, net . . 13,459 (14,817) 75,382
Excess tax benefits from share-based compensation arrangements . . . . . . . . . (4,404) (8,810) (6,569)
Net cash provided by operating activities . . . . . . . . . . . . . . . . . . . . . . . . . . . . . . 1,596,129 1,402,922 1,124,679
Cash flows from investing activities:
Additions to plant and equipment. . . . . . . . . . . . . . . . . . . . . . . . . . . . . . . . . . . . (515,963) (603,242) (513,934)
Proceeds from sales of plant and equipment . . . . . . . . . . . . . . . . . . . . . . . . . . . 13,320 16,008 21,037
Acquisition of businesses, net of cash acquired . . . . . . . . . . . . . . . . . . . . . . . . . (55,259) (59,322) (114,378)
Decrease (increase) in restricted cash . . . . . . . . . . . . . . . . . . . . . . . . . . . . . . . . 2,342 (2,155) (2,243)
Net cash used for investing activities . . . . . . . . . . . . . . . . . . . . . . . . . . . . . . . . . (555,560) (648,711) (609,518)
Cash flows from financing activities:
Bank and commercial paper borrowings (repayments), net. . . . . . . . . . . . . . . . . . (550,726) 121,858 240,017
Other debt borrowings . . . . . . . . . . . . . . . . . . . . . . . . . . . . . . . . . . . . . . . . . . . 757,972 5,290 500,987
Other debt repayments . . . . . . . . . . . . . . . . . . . . . . . . . . . . . . . . . . . . . . . . . . . (7,628) (109,656) (413,383)
Debt issuance costs . . . . . . . . . . . . . . . . . . . . . . . . . . . . . . . . . . . . . . . . . . . . . (4,192) (7) (3,998)
Cash (paid for) received from termination of interest rate swap . . . . . . . . . . . . . . — — (21,196)
Common stock reissued from treasury. . . . . . . . . . . . . . . . . . . . . . . . . . . . . . . . 128,238 221,736 128,055
Treasury stock purchases . . . . . . . . . . . . . . . . . . . . . . . . . . . . . . . . . . . . . . . . . (529,179) (550,865) (544,131)
Dividends paid . . . . . . . . . . . . . . . . . . . . . . . . . . . . . . . . . . . . . . . . . . . . . . . . . (497,467) (445,416) (397,537)
Excess tax benefits from share-based compensation arrangements . . . . . . . . . . . 4,404 8,810 6,569
Net cash used for financing activities . . . . . . . . . . . . . . . . . . . . . . . . . . . . . . . . . (698,578) (748,250) (504,617)
Effect of exchange rates on cash . . . . . . . . . . . . . . . . . . . . . . . . . . . . . . . . . . . . . 1,689 14 (325)
Net increase in cash . . . . . . . . . . . . . . . . . . . . . . . . . . . . . . . . . . . . . . . . . . . . . . 343,680 5,975 10,219
Cash at beginning of year . . . . . . . . . . . . . . . . . . . . . . . . . . . . . . . . . . . . . . . . . . . 207,872 201,897 191,678
Cash at end of year . . . . . . . . . . . . . . . . . . . . . . . . . . . . . . . . . . . . . . . . . . . . . . . $ 551,552 $ 207,872 $ 201,897
Supplemental disclosures of cash flow information:
Cash paid during the year for:
Interest . . . . . . . . . . . . . . . . . . . . . . . . . . . . . . . . . . . . . . . . . . . . . . . . . . . . $ 98,330 $ 107,109 $ 107,242
Income taxes . . . . . . . . . . . . . . . . . . . . . . . . . . . . . . . . . . . . . . . . . . . . . . . . 530,169 563,968 619,442
See Notes to Consolidated Financial Statements
38