Sysco 2008 Annual Report Download - page 34
Download and view the complete annual report
Please find page 34 of the 2008 Sysco annual report below. You can navigate through the pages in the report by either clicking on the pages listed below, or by using the keyword search tool below to find specific information within the annual report.-
 1
1 -
2
-
3
-
4
-
5
-
6
-
7
-
8
-
9
-
10
-
11
-
12
-
13
-
14
-
15
-
16
-
17
-
18
-
19
-
20
-
21
-
22
-
23
-
 24
24 -
 25
25 -
 26
26 -
 27
27 -
 28
28 -
 29
29 -
 30
30 -
 31
31 -
 32
32 -
 33
33 -
 34
34 -
 35
35 -
 36
36 -
 37
37 -
 38
38 -
 39
39 -
 40
40 -
 41
41 -
 42
42 -
 43
43 -
 44
44 -
45
-
46
-
47
-
48
-
49
-
50
-
51
-
52
-
53
-
54
-
55
-
56
-
57
-
58
-
59
-
60
-
61
-
62
-
63
-
64
-
65
-
66
-
67
-
68
-
69
-
70
-
71
-
72
-
73
-
74
-
75
-
76
-
77
-
78
-
79
-
80
-
81
-
82
-
83
-
84
-
85
-
86
-
87
-
88
-
89
-
90
-
91
-
92
-
93
-
94
-
95
-
96
 |
 |
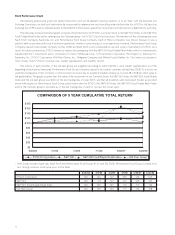
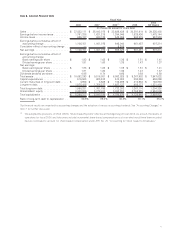
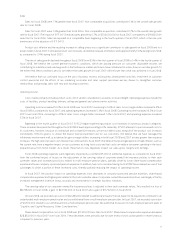
Stock Performance Graph
The following performance graph and related information shall not be deemed “soliciting material” or to be “filed” with the Securities and
Exchange Commission, nor shall such information be incorporated by reference into any future filing under the Securities Act of 1933 or the Securities
Exchange Act of 1934, each as amended, except to the extent that the Company specifically incorporates such information by reference into such filing.
The following stock performance graph compares the performance of SYSCO’s Common Stock to the S&P 500 Index, to the S&P 500
Food/Staple Retail Index and to a peer group, the “old peer group,” for SYSCO’s last five fiscal years.The members of the old peer group were
Nash Finch Company, Supervalu, Inc. and Performance Food Group Company. Each of these companies was chosen because it was a
publicly held corporation with food distribution operations similar in some respects to our operations; however, Performance Food Group
Company ceased to be a public company in May 2008 and Nash Finch is not comparable in size and scope of operations to SYSCO. As a
result, for future comparisons, SYSCO intends to replace this peer group with the S&P 500 Food/Staple Retail Index, which is maintained by
Standard & Poor’s Corporation and is composed of Costco Wholesale Corp., CVS Caremark Corporation, The Kroger Co., Safeway Inc.,
Supervalu, Inc., SYSCO Corporation, Wal-Mart Stores, Inc., Walgreen Company and Whole Foods Market, Inc. This index was chosen to
more closely match SYSCO’s revenue size, market capitalization and markets served.
The returns of each member of the old peer group are weighted according to each member’s stock market capitalization as of the
beginning of each period measured. Performance Food Group Company ceased to be a public company during May 2008. As a result, we
used the closing price of this company’s common stock on its last day as a publicly traded company as its June 28, 2008 per share value in
the graph below. The graph assumes that the value of the investment in our Common Stock, the S&P 500 Index, the S&P 500 Food/Staple
Index and the old peer group was $100 on the last trading day of fiscal 2003, and that all dividends were reinvested. Except as provided
above with respect to Performance Food Group, performance data for SYSCO, the S&P 500 Index, the S&P 500 Food/Staple Retail Index
and for the old peer group is provided as of the last trading day of each of our last five fiscal years.
COMPARISON OF 5 YEAR CUMULATIVE TOTAL RETURN
$0
$20
$40
$60
$80
$100
$120
$140
$160
$180
6/28/03 7/3/04 7/2/05 7/1/06 6/30/07 6/28/08
SYSCO Corporation S&P 500 S&P 500 Food/Staple Retail Index Old Peer Group*
* Peer Group includes Supervalu, Nash Finch and Performance Food Group (As of June 28, 2008, Performance Food Group is valued at its
last closing common stock price prior to the date)
6/28/03 7/3/04 7/2/05 7/1/06 6/30/07 6/28/08
SYSCO Corporation 100 120 127 109 120 105
S&P 500 100 117 127 137 165 143
S&P 500 Food/Staple Retail Index 100 105 107 110 117 122
Old Peer Group 100 109 124 117 170 128
10