Sysco 2008 Annual Report Download - page 75
Download and view the complete annual report
Please find page 75 of the 2008 Sysco annual report below. You can navigate through the pages in the report by either clicking on the pages listed below, or by using the keyword search tool below to find specific information within the annual report.-
 1
1 -
2
-
3
-
4
-
5
-
6
-
7
-
8
-
9
-
10
-
11
-
12
-
13
-
14
-
15
-
16
-
17
-
18
-
19
-
20
-
21
-
22
-
23
-
24
-
25
-
26
-
27
-
28
-
29
-
30
-
31
-
32
-
33
-
34
-
35
-
36
-
37
-
38
-
39
-
40
-
41
-
42
-
43
-
44
-
45
-
46
-
47
-
48
-
49
-
50
-
51
-
52
-
53
-
54
-
55
-
56
-
57
-
58
-
59
-
60
-
61
-
62
-
63
-
64
-
 65
65 -
 66
66 -
 67
67 -
 68
68 -
 69
69 -
 70
70 -
 71
71 -
 72
72 -
 73
73 -
 74
74 -
 75
75 -
 76
76 -
 77
77 -
 78
78 -
 79
79 -
 80
80 -
 81
81 -
 82
82 -
 83
83 -
 84
84 -
 85
85 -
86
-
87
-
88
-
89
-
90
-
91
-
92
-
93
-
94
-
95
-
96
 |
 |

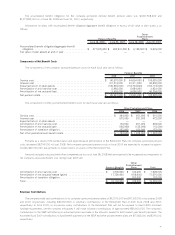
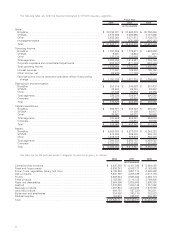
The percentage of the fair value of plan assets by asset category is as follows:
June 28,
2008
June 30,
2007
Equity securities . . . . . . . . . . . . . . . . . . . . . . . . . . . . . . . . . . . . . . . . . . . . . . . . . . . . . . . . . . . . . . . . . . 68.8% 72.0%
Debt securities . . . . . . . . . . . . . . . . . . . . . . . . . . . . . . . . . . . . . . . . . . . . . . . . . . . . . . . . . . . . . . . . . . . 31.2 28.0
Total . . . . . . . . . . . . . . . . . . . . . . . . . . . . . . . . . . . . . . . . . . . . . . . . . . . . . . . . . . . . . . . . . . . . . . . . . . . 100.0% 100.0%
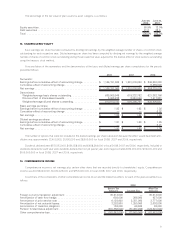
13. SHAREHOLDERS’ EQUITY
Basic earnings per share has been computed by dividing net earnings by the weighted average number of shares of common stock
outstanding for each respective year. Diluted earnings per share has been computed by dividing net earnings by the weighted average
number of shares of common stock outstanding during those respective years adjusted for the dilutive effect of stock options outstanding
using the treasury stock method.
A reconciliation of the numerators and the denominators of the basic and diluted earnings per share computations for the periods
presented follows:
2008 2007 2006
Numerator:
Earnings before cumulative effect of accounting change . . . . . . . . . $ 1,106,151,000 $ 1,001,076,000 $ 846,040,000
Cumulative effect of accounting change . . . . . . . . . . . . . . . . . . . . . — — 9,285,000
Net earnings . . . . . . . . . . . . . . . . . . . . . . . . . . . . . . . . . . . . . . . . . $ 1,106,151,000 $ 1,001,076,000 $ 855,325,000
Denominator:
Weighted-average basic shares outstanding . . . . . . . . . . . . . . . . . 605,905,545 618,332,752 621,382,766
Dilutive effect of share-based awards . . . . . . . . . . . . . . . . . . . . . 5,065,238 8,034,046 7,417,881
Weighted-average diluted shares outstanding. . . . . . . . . . . . . . . . 610,970,783 626,366,798 628,800,647
Basic earnings per share:
Earnings before cumulative effect of accounting change . . . . . . . . . $ 1.83 $ 1.62 $ 1.36
Cumulative effect of accounting change . . . . . . . . . . . . . . . . . . . . . — — 0.02
Net earnings . . . . . . . . . . . . . . . . . . . . . . . . . . . . . . . . . . . . . . . . . $ 1.83 $ 1.62 $ 1.38
Diluted earnings per share:
Earnings before cumulative effect of accounting change . . . . . . . . . $ 1.81 $ 1.60 $ 1.35
Cumulative effect of accounting change . . . . . . . . . . . . . . . . . . . . . — — 0.01
Net earnings . . . . . . . . . . . . . . . . . . . . . . . . . . . . . . . . . . . . . . . . . $ 1.81 $ 1.60 $ 1.36
The number of options that were not included in the diluted earnings per share calculation because the effect would have been anti-
dilutive was approximately 33,400,000, 21,900,000 and 28,500,000 for fiscal 2008, 2007 and 2006, respectively.
Dividends declared were $513,593,000, $456,438,000 and $408,264,000 in fiscal 2008, 2007 and 2006, respectively. Included in
dividends declared for each year were dividends declared but not yet paid at year-end of approximately $132,000,000, $116,000,000 and
$105,000,000 in fiscal 2008, 2007 and 2006, respectively.
14. COMPREHENSIVE INCOME
Comprehensive income is net earnings plus certain other items that are recorded directly to shareholders’ equity. Comprehensive
income was $1,018,664,000, $1,030,025,000 and $953,620,000 in fiscal 2008, 2007 and 2006, respectively.
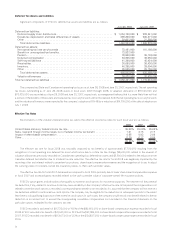
A summary of the components of other comprehensive income (loss) and the related tax effects for each of the years presented is as
follows:
Before-Tax
Amount Income Tax
After-Tax
Amount
2008
Foreign currency translation adjustment . . . . . . . . . . . . . . . . . . . . . . . . 30,514,000 — 30,514,000
Amortization of cash flow hedge. . . . . . . . . . . . . . . . . . . . . . . . . . . . . . 693,000 266,000 427,000
Amortization of prior service cost . . . . . . . . . . . . . . . . . . . . . . . . . . . . . 6,128,000 2,351,000 3,777,000
Amortization of net actuarial losses . . . . . . . . . . . . . . . . . . . . . . . . . . . . 3,253,000 1,250,000 2,003,000
Amortization of transition obligation . . . . . . . . . . . . . . . . . . . . . . . . . . . 153,000 60,000 93,000
Pension funded status adjustment . . . . . . . . . . . . . . . . . . . . . . . . . . . . (201,788,000) (77,487,000) (124,301,000)
Other comprehensive loss . . . . . . . . . . . . . . . . . . . . . . . . . . . . . . . . . . $ (161,047,000) $ (73,560,000) $ (87,487,000)
51