Sysco 2008 Annual Report Download - page 4
Download and view the complete annual report
Please find page 4 of the 2008 Sysco annual report below. You can navigate through the pages in the report by either clicking on the pages listed below, or by using the keyword search tool below to find specific information within the annual report.-
 1
1 -
 2
2 -
 3
3 -
 4
4 -
 5
5 -
 6
6 -
 7
7 -
 8
8 -
 9
9 -
 10
10 -
 11
11 -
 12
12 -
 13
13 -
 14
14 -
 15
15 -
16
-
17
-
18
-
19
-
20
-
21
-
22
-
23
-
24
-
25
-
26
-
27
-
28
-
29
-
30
-
31
-
32
-
33
-
34
-
35
-
36
-
37
-
38
-
39
-
40
-
41
-
42
-
43
-
44
-
45
-
46
-
47
-
48
-
49
-
50
-
51
-
52
-
53
-
54
-
55
-
56
-
57
-
58
-
59
-
60
-
61
-
62
-
63
-
64
-
65
-
66
-
67
-
68
-
69
-
70
-
71
-
72
-
73
-
74
-
75
-
76
-
77
-
78
-
79
-
80
-
81
-
82
-
83
-
84
-
85
-
86
-
87
-
88
-
89
-
90
-
91
-
92
-
93
-
94
-
95
-
96
 |
 |

tO OUr SHarEHOLDErS:
The quality of our business strategy was
clear in 2008 as SYSCO performed at
historic levels for the fiscal year. With sales
of $37.5 billion, we achieved our thirty-eighth
year of sales growth. A greater accomplish-
ment is that we were able to leverage that
growth to record net earnings of $1.1 billion
in the face of a difficult economy.
We recognized the economic signs early –
we’ve been through tough economic cycles
before – and responded quickly to contain
costs while continuing to invest in strength-
ening our customer relationships. As a
result, we’ve been able to not only build a
strong bottom line, but build market share
in the process.
Reflecting our sound strategy, return on
average total capital grew to 21 percent
for fiscal year 2008 and return on average
shareholders’ equity remained strong,
exceeding 33 percent.
High fuel costs tested the foodservice
industry on multiple levels. Most impor-
tantly, it affected consumer behavior. As
consumers paid more at the gas pump,
they spent less in other areas, including
dining out. Second, high fuel prices affected
our costs of operation. Although many
of our contracts allow us to add on fuel
surcharges, with one of the largest private
truck fleets in the industry, we certainly
feel the “pain at the pump”.
Skyrocketing fuel costs also contributed to
rising food prices, beginning with growers,
suppliers and processors. As these costs
are passed through the food chain, they
challenge our customers, the restaurants
that are caught between rising costs and
customers with shrinking disposable income.
Fortunately, SYSCO has the financial
strength and strategic insight to address
these challenges in ways that we believe
will leave us better positioned on the other
side of this economic downturn.
The solution is not one silver bullet, but
hundreds of improvements across our
organization that help us manage costs
while focusing on our mission of helping our
customers succeed. Our people have done
an outstanding job of aligning their efforts
to achieve these inseparable goals.
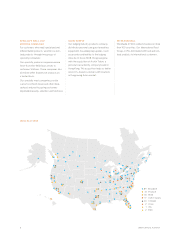
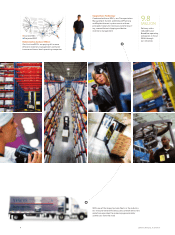
SUppLY CHain EFFiCiEnCY
Long before the current increase in energy
costs, we embarked on a national supply
chain initiative to drive inefficiencies
out of the system, which extends from
our growers and suppliers to more than
400,000 customers served through
180 SYSCO distribution locations. This
three-pronged initiative that began in
2002 has already paid off in reduced
transportation costs and more efficient
service to our customers.
Our Transportation Management System
is a software application that has allowed
us to reduce the number of inbound freight
miles traveled by increasing our truck fill
rates. In 2008, we increased truck fill rates
an additional two percent as we’ve continued
to manage our inbound freight.
This year we began shipping to operating
companies from our second redistribution
center (RDC) in Alachua, Florida. Stream-
lining distribution (rather than shipping
directly from suppliers to individual oper-
ating companies) has had a great impact.
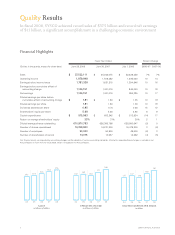
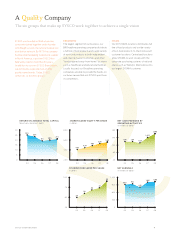
• Salesgrew$2.5billionto$37.5billion,representing38straightyears
ofsalesgrowth
• Operatingincomegrew10%to$1.9billion
• Recordnetearningsof$1.1billion
• Dilutedearningspersharegrew13%to$1.81
• Returnonaveragetotalcapitalgrewto21%
• Returnedover$1billiontoshareholdersintheformofdividendsand
sharerepurchases
“Hundreds of improvements across our organization
have h≤ped us manage co◊s wh∏e focusing on our mission
of h≤ping our cu◊omers succeed.
”