Sysco 2008 Annual Report Download - page 44
Download and view the complete annual report
Please find page 44 of the 2008 Sysco annual report below. You can navigate through the pages in the report by either clicking on the pages listed below, or by using the keyword search tool below to find specific information within the annual report.-
 1
1 -
2
-
3
-
4
-
5
-
6
-
7
-
8
-
9
-
10
-
11
-
12
-
13
-
14
-
15
-
16
-
17
-
18
-
19
-
20
-
21
-
22
-
23
-
24
-
25
-
26
-
27
-
28
-
29
-
30
-
31
-
32
-
33
-
 34
34 -
 35
35 -
 36
36 -
 37
37 -
 38
38 -
 39
39 -
 40
40 -
 41
41 -
 42
42 -
 43
43 -
 44
44 -
 45
45 -
 46
46 -
 47
47 -
 48
48 -
 49
49 -
 50
50 -
 51
51 -
 52
52 -
 53
53 -
 54
54 -
55
-
56
-
57
-
58
-
59
-
60
-
61
-
62
-
63
-
64
-
65
-
66
-
67
-
68
-
69
-
70
-
71
-
72
-
73
-
74
-
75
-
76
-
77
-
78
-
79
-
80
-
81
-
82
-
83
-
84
-
85
-
86
-
87
-
88
-
89
-
90
-
91
-
92
-
93
-
94
-
95
-
96
 |
 |
Liquidity and Capital Resources
SYSCO provides marketing and distribution services to foodservice customers primarily throughout the United States and Canada. We
intend to continue to expand our market share through profitable sales growth, foldouts and acquisitions. We also strive to increase the
effectiveness of our operations through the use of technology and our supply chain and other strategic initiatives. These objectives require
continuing investment. Our resources include cash provided by operations and access to capital from financial markets.
Our operations historically have produced significant cash flow. Cash generated from operations is first allocated to working capital
requirements; investments in facilities, systems, fleet and other equipment; cash dividends; and acquisitions compatible with our overall
growth strategy. Any remaining cash generated from operations may be applied toward a portion of the cost of the share repurchase
program, while the remainder of the cost may be financed with additional debt. Our share repurchase program is used primarily to offset
shares issued under various employee benefit and compensation plans, to reduce shares outstanding (which may have the net effect of
increasing earnings per share) and to aid in managing the ratio of long-term debt to total capitalization. Historically, our long-term debt to
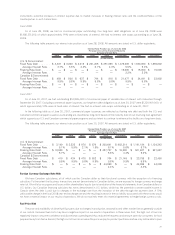
total capitalization ratio has generally been in the range of 35% and 40%.This ratio was 36.8% and 35.0% as of June 28, 2008 and June 30,
2007, respectively. For purposes of calculating this ratio, long-term debt includes both the current maturities and long-term portion. We
continue to assess and review the most appropriate capital structure as well as the appropriate leverage ratios with which to measure that
capital structure. As a part of our on-going strategic analysis, we regularly evaluate business opportunities, including potential acquisitions
and sales of assets and businesses, and our overall capital structure. These transactions may materially impact our liquidity, borrowing
capacity, leverage ratios and capital availability.
We believe that our cash flows from operations, the availability of additional capital under our existing commercial paper programs and
bank lines of credit and our ability to access capital from financial markets in the future, including issuances of debt securities under our shelf
registration statement filed with the Securities and Exchange Commission (SEC), will be sufficient to meet our anticipated cash
requirements over at least the next twelve months, while maintaining sufficient liquidity for normal operating purposes.
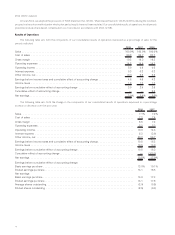
Operating Activities
We generated $1,596,129,000 in cash flow from operations in fiscal 2008, $1,402,922,000 in fiscal 2007 and $1,124,679,000 in fiscal 2006.
Cash flow from operations in fiscal 2008, fiscal 2007 and fiscal 2006 was primarily due to net income in these years, reduced by increases in
inventory balances and increases in accounts receivable balances, partially offset by an increase in accounts payable balances. The increases in
accounts receivable and inventory balances were primarily due to sales growth.The accounts payable balances did not increase at the same rate as
inventory increases. Accounts payable balances are impacted by many factors, including changes in product mix, cash discount terms and changes
in payment terms with vendors.
Cash flow from operations was negatively impacted by a decrease in accrued expenses of $22,721,000 during fiscal 2008, and was
positively impacted by increases in accrued expenses of $132,936,000 during fiscal 2007 and $29,161,000 during fiscal 2006.The decrease
in accrued expenses during fiscal 2008 was primarily due to the reversal of a product liability claim which is further explained below. This
decrease was partially offset by increased accrued interest due to fixed-rate debt issued in fiscal 2008 and an increase to a provision related
to a multi-employer pension plan. See additional discussion of multi-employer pension plans at “Liquidity and Capital Resources, Other
Considerations.” The increase in accrued expenses during fiscal 2007 was primarily due to increased accruals for fiscal 2007 incentive
bonuses due to improved operating results over fiscal 2006. The increase in accrued expenses during fiscal 2006 was related to various
miscellaneous accruals.
In fiscal 2007, we recorded a liability for a product liability claim of $50,296,000 and the corresponding insurance receivable of
$48,296,000, included within prepaid expenses and other current assets. In fiscal 2008, these amounts were reversed as our insurance
carrier and other parties paid the full amount of the judgment in excess of our deductible. See further discussion of the product liability claim
under Note 18, Commitments and Contingencies, in the Notes to Consolidated Financial Statements in Item 8.
Other long-term liabilities and prepaid pension cost, net, increased $13,459,000 during fiscal 2008, decreased $14,817,000 in fiscal
2007 and increased $75,382,000 in fiscal 2006. The increase in fiscal 2008 was primarily attributable to an increase in deferred
compensation from incentive compensation deferrals of prior-year annual incentive bonuses and the accrual of interest on our liability for
unrecognized tax benefits. These increases were partially offset by the recording of net company-sponsored pension costs and the timing of
pension contributions to our company-sponsored plans. In fiscal 2007 and 2006, the change in these accounts was primarily attributable to
the recording of net company-sponsored pension costs and the timing and amount of pension contributions to our company-sponsored
plans. In fiscal 2007, our pension contributions exceeded the amount of net pension costs recognized during the year resulting in a net cash
outflow. In fiscal 2006, the net pension costs recorded exceeded the amount of pension contributions during the year resulting in a net cash
inflow. We recorded net company-sponsored pension costs of $65,837,000, $74,591,000 and $130,592,000 during fiscal 2008, fiscal
2007 and fiscal 2006, respectively. Our contributions to our company-sponsored defined benefit plans were $92,670,000, $91,163,000
and $73,764,000 during fiscal 2008, fiscal 2007 and fiscal 2006, respectively. We expect to contribute approximately $97,000,000 to our
company-sponsored defined benefit plans in fiscal 2009.
20